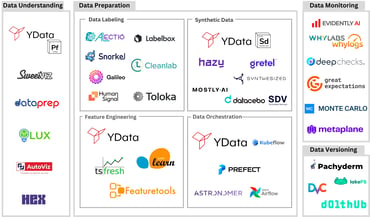
As the Data-Centric AI paradigm has come to prove that focusing on data quality will have the most transformative impact in industries across all verticals, more and more companies and organizations worldwide are starting to look for the best practices to fully leverage their data assets. The key, not surprisingly, relies on a comprehensive understanding of those data assets, for which a data profiling solution is absolutely indispensable.
A successful data understanding encompasses several fundamental tasks, from providing the dataset’s basic descriptors and characteristics to a thorough analysis of the relationships between the existing features in data, through univariate and multivariate analysis.
Getting a hold of the relationships between features is instrumental to enhancing decision-making across every domain, but becomes especially critical when handling high-dimensional data, where the datasets are composed of a large number of features in comparison to their number of records.
From telecommunications to healthcare, there are several applications that frequently generate high-dimensional datasets. These require specialized data profiling solutions to handle this “curse of dimensionality”.
Unlocking Data Understanding for High-Dimensional Data
Successfully bypassing the quirks of high-dimensional data, Fabric Data Catalog offers a flexible and intuitive experience when handling datasets characterized by a large number of columns/features.
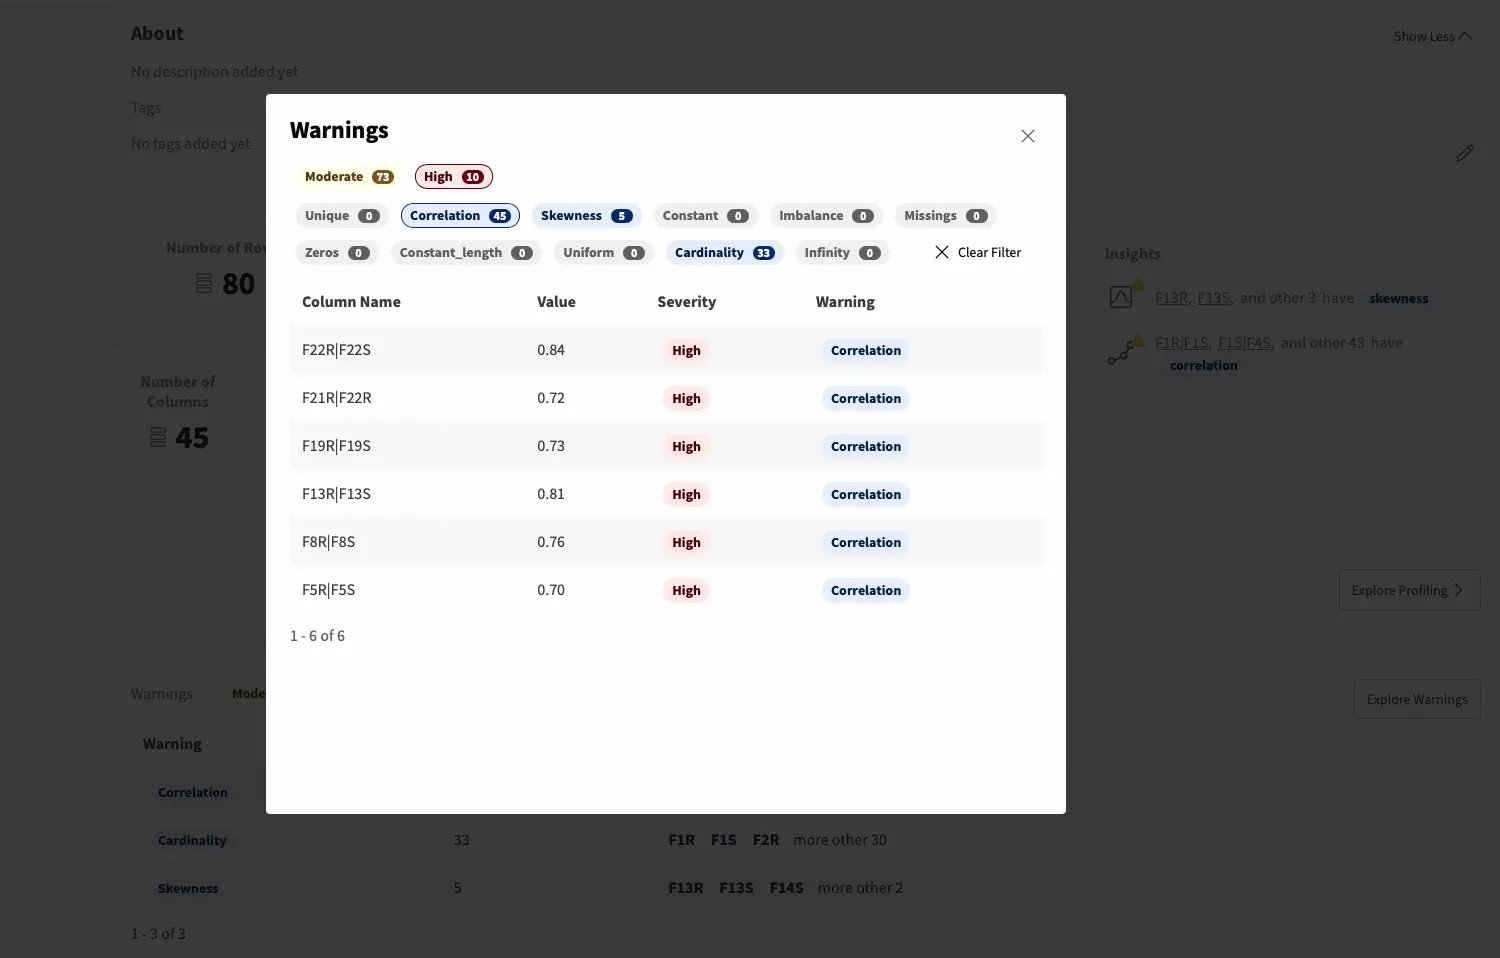
Data quality warnings can be interactively explored to determine the main issues that the data may be subjected to and start uncovering feature associations to further explore during data profiling.
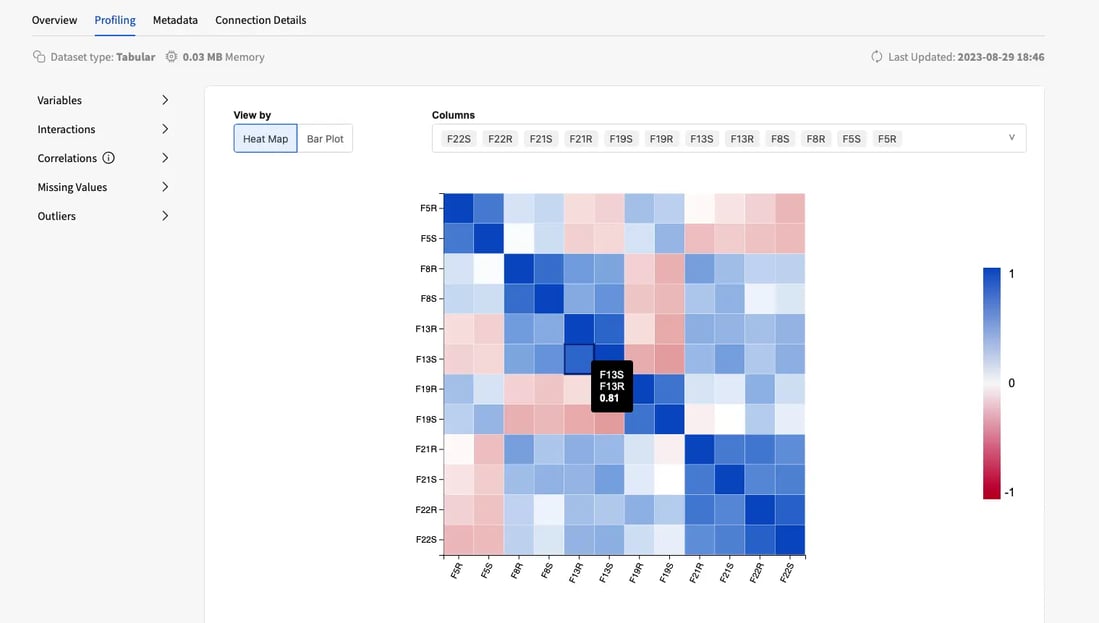
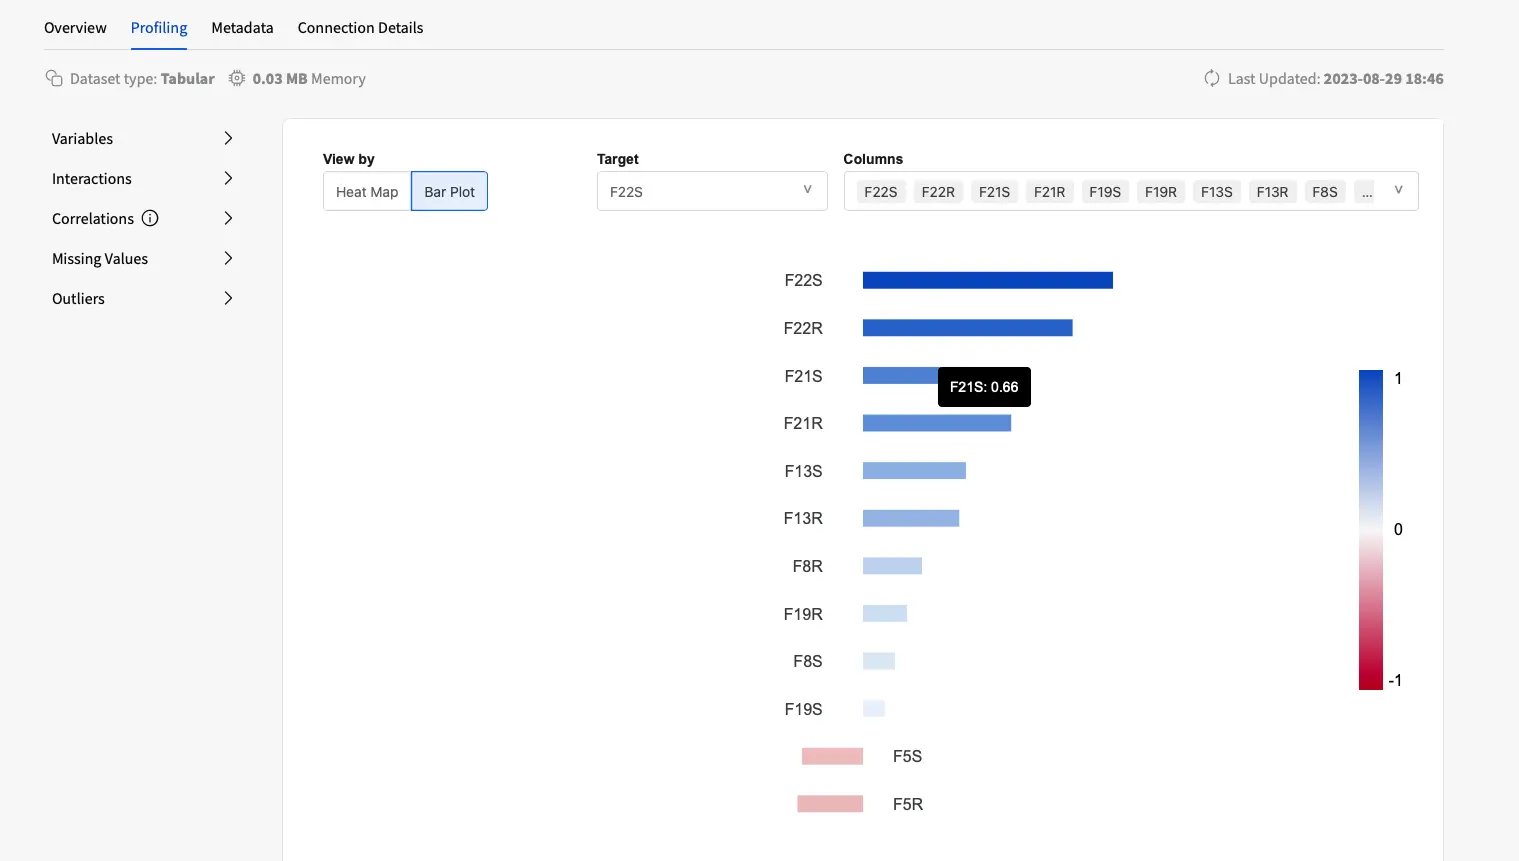
The data profiling experience then enables a seamless investigation of multivariate analyses, enabling data teams to interact with the visualizations, so that the process is intuitive and responds to the natural flow of the exploratory data analysis.
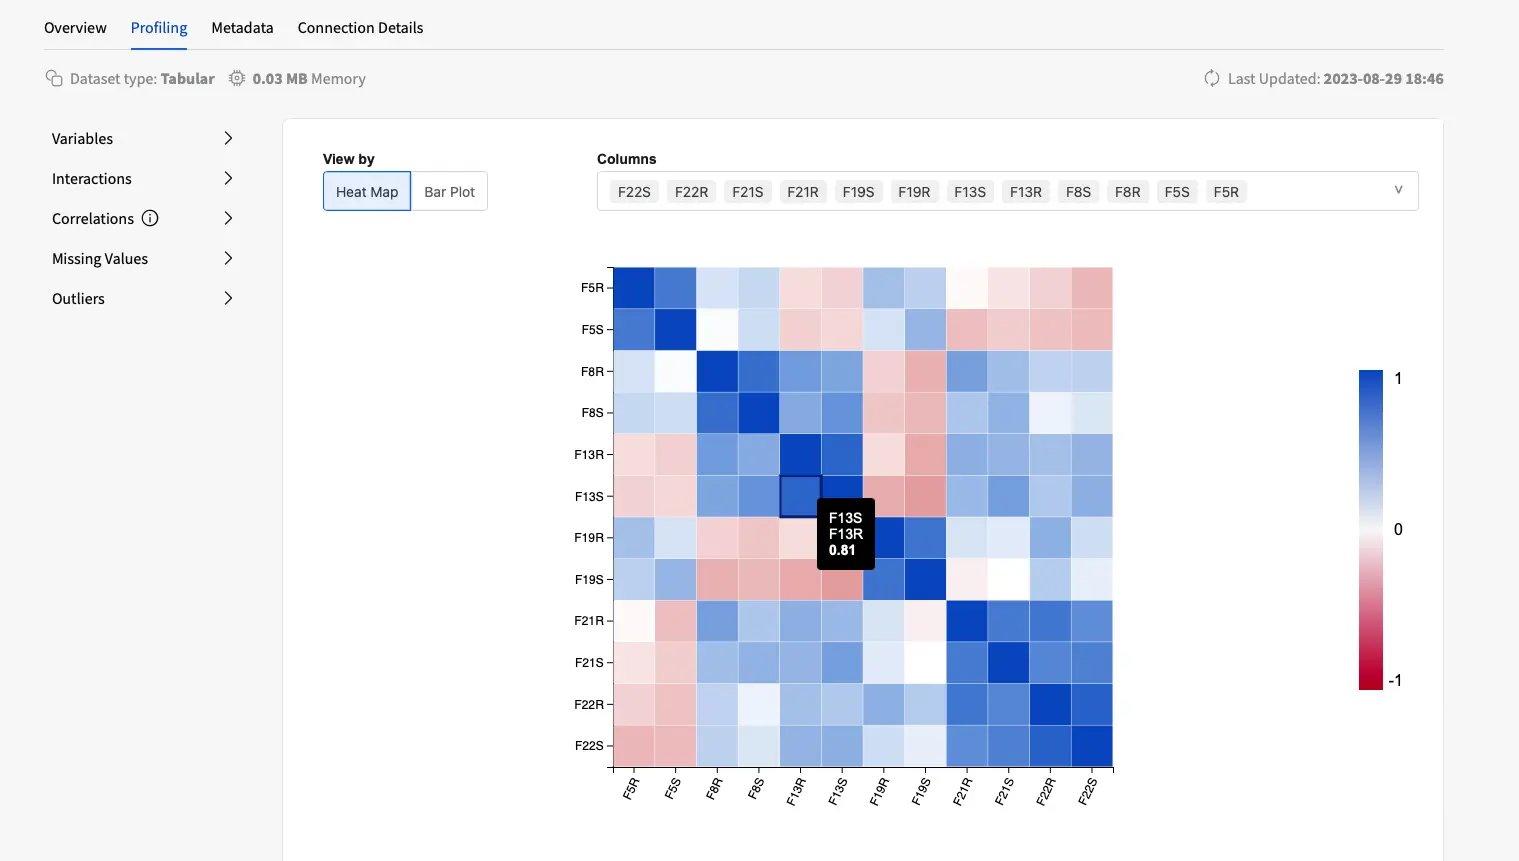
Data teams can explore the visualizations by filtering the data of interest and interacting with the plots as they move towards a deeper understanding of the data. If a particularly relevant relationship comes up during the analysis, the relevant features can be inspected in more detail and matched against the remaining with targeted visualization to uncover unexpected insights.
Applications of High-Dimensional Data Profiling
High-dimensional data is a characteristic of several real-world applications, from finance, transportation, healthcare, and e-commerce, among others. Here are a few industries where the Fabric’s robust exploration of high-dimensional data can highly impact decision making:
- Financial Services: Generating multivariate data nearly every second (customer transaction history, type, amount, location), high-dimensional profiling can help identify correlations between assets and create a better portfolio diversification, as well as produce accurate risk assessment, trading strategies, and credit scoring;
- Telecommunications: Checking relationships between all available data (callers, receivers, network infrastructure, plan) can reveal peak call times, areas with high and low activity, customers with faulty communications, allowing data teams to quickly find patterns to predict customer churn, optimize network capacity, and allocate appropriate resources, fostering cost-efficient investments;
- Utilities and Retail: Smart meter data (consumption, time of day, weather, household characteristics) and e-commerce transactions (products, purchase times, payment methods, categories) are typically high-dimensional. Flexible data profiling fosters the understanding of which factors contribute the most to high energy consumption or customer-product associations and enables the creation of personalized plans, cross-selling opportunities, and cost-reduction strategies;
- Healthcare and Pharma: Genomic, biomarkers, and drug discovery are just a few examples where thousands of attributes are collected for analysis. Flexible data profiling lets data scientists identify expression patterns associated with specific attributes and potentially discover new trends and therapeutic targets.
Conclusions
Dedicated to fostering data literacy and best practices in data understanding, YData has been shaping the landscape of Data-Centric AI with open-source tooling such as ydata-profiling, and expert solutions, such as Fabric Data Catalog.
Fabric’s Data Profiling experience allows data teams to make sense of high-dimensional data through tailored and interactive visual assessment. By extracting insights from these complex datasets, organizations can not only optimize decision-making but actively drive innovation and accelerate their development.
If you’re ready to drive your development process to the next level, learn more about the benefits of Fabric and sign up for the community version to start leveraging your data assets, or contact us for trial access to full platform.
