As organizations increasingly rely on synthetic data to improve their machine learning models, ensuring that the relations like pairwise distributions and correlations are kept in synthetic data is part of the fidelity assessment whenever validating the quality of the synthetic data when compared to the original data.
In a previous article, we explored the evaluation of synthetic data quality through an univariate analysis. However, real-world datasets are inherently multivariate, with intricate relationships among various features. Through multivariate analysis, we can determine whether the complex dependencies and correlations that exist in the data are replicated in the synthetic data.
How much information is retained in my synthetic data?
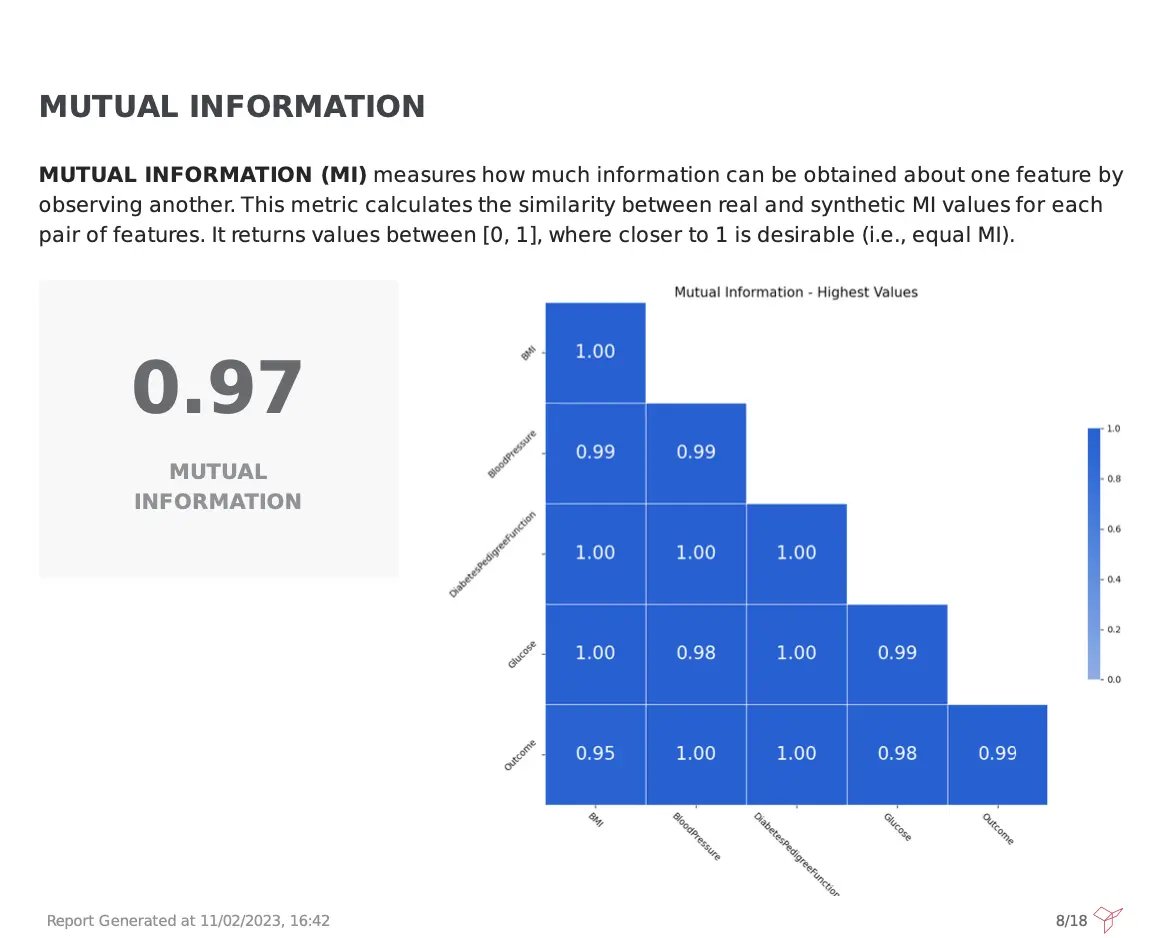
A visual evaluation of correlation plots can be extremely useful to validate the observed correlations but is not always enough. For that reason, it is great to add a more robust metric such as Mutual Information (MI).
Fabric’s Synthetic Data Quality report, depicts the MI for all dataset columns, measuring the reduction of uncertainty of one variable based on the values of another variable. A weighted score between [0,1] of all the pairwise computations is also provided, making it faster and easier to digest the overall quality of the synthetic data for this metric. Higher values are preferred, and in this case, a 0.97 score was achieved, meaning that the synthetic data is great, retaining the same information level as observed in the original one.
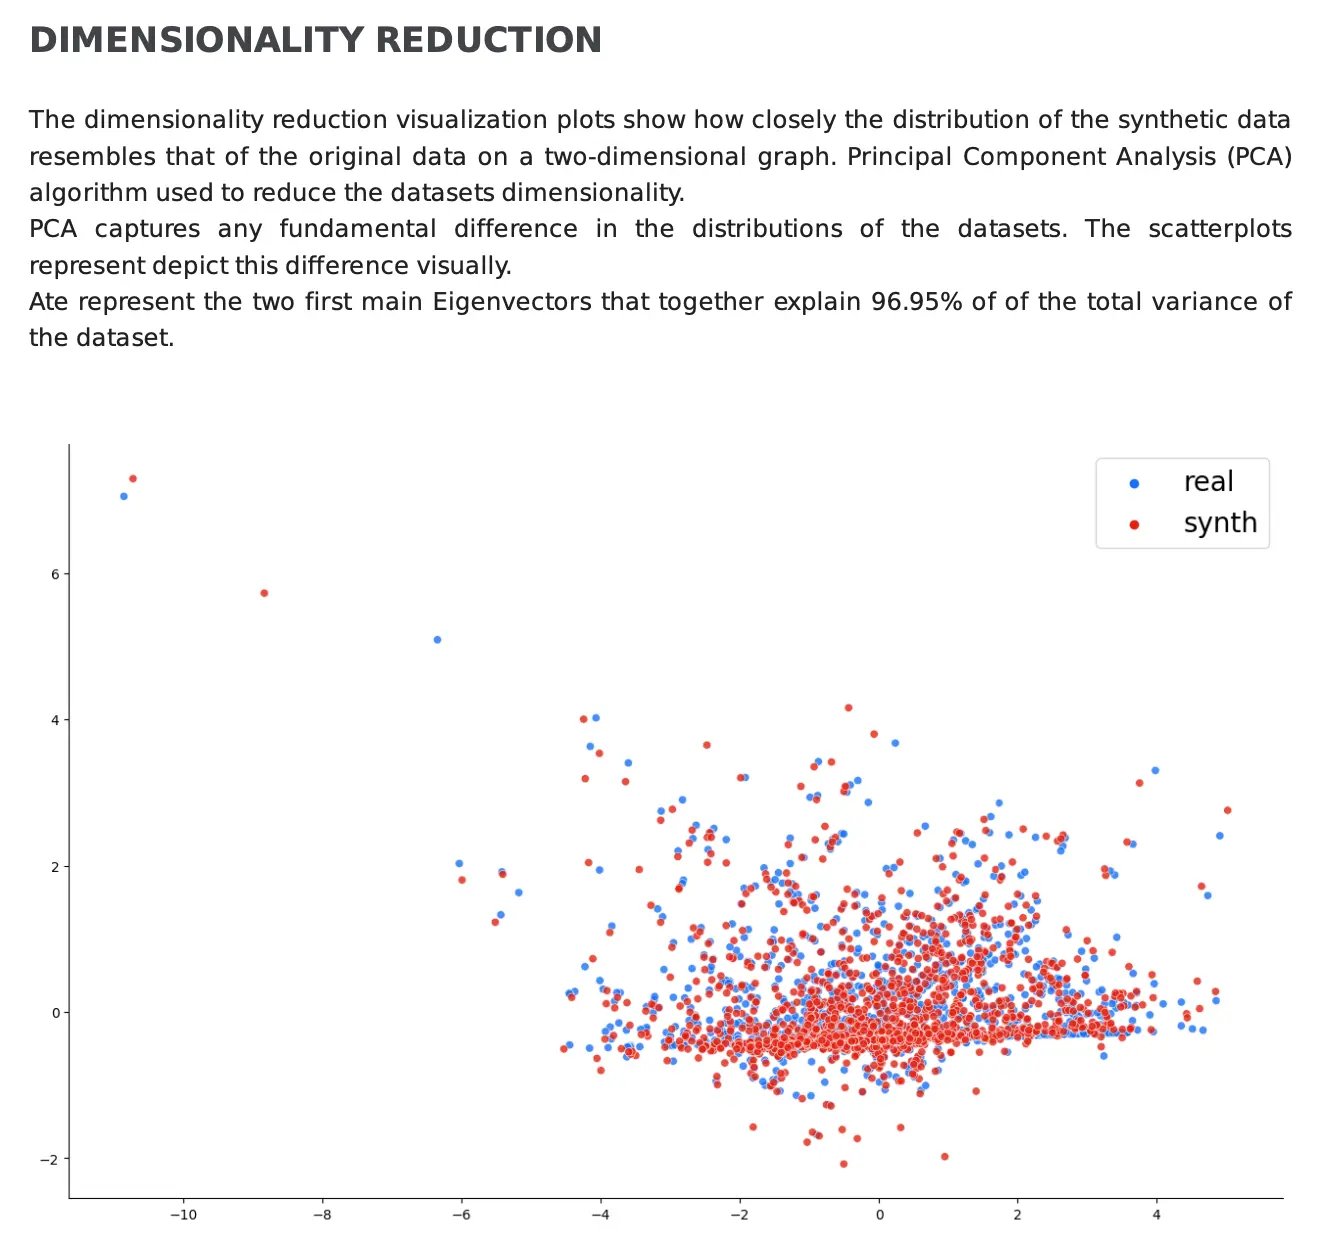
How to simplify the evaluation of relations?
But more often than not, datasets are quite complex, with a lot of variables and different relations. In order to make it simpler to understand whether these complex relations are shared by both the real and synthetic data, Dimensionality Reduction is key. In Fabric’s PDF report, both the real data and synthetic are plotted into a reduced-dimensional space leveraging Principal Component Analysis (PCA). Overall, the closer the distribution of the points, the better the quality of the generated data.
However, it is important to consider the total variance explained by the plotted eigenvectors. If the total variance explained by the plotted eigenvectors is very high, the more faithfully they represent the variability in the dataset, making the plot more accurate and reliable to validate the synthetic data.
In the example below, we can determine that the synthetic data faithfully replicates the structure of the original data since the eigenvectors explain 96.95% of the total variance and the distribution of data points is very similar in the plot:
Conclusion
In the pursuit of high-quality synthetic data, Fabric’s synthetic data generation methods not only excel in reflecting the individual features structure but also in preserving the complex relationships and interactions between them.
Try out Fabric Community to kickstart your synthetic data journey and delve into our synthetic data quality PDF report to learn more about how to evaluate the data quality of your synthetic datasets.
Feel free to contact our specialists for additional questions and join the Data-Centric AI Community to connect with other data enthusiasts.