One of the most important applications of synthetic data is its use in developing machine learning solutions – to train and test machine learning models – when real data is hard to collect or sensitive to share. For that reason, it is crucial to validate that synthetic data can hold the same predictive power as real data.
In this blog post, we will explore how Fabric determines if a machine model trained on your synthetic data can deliver the same prediction performance as real data, and therefore be applied in real production environments.
How good is the prediction performance of my synthetic data?
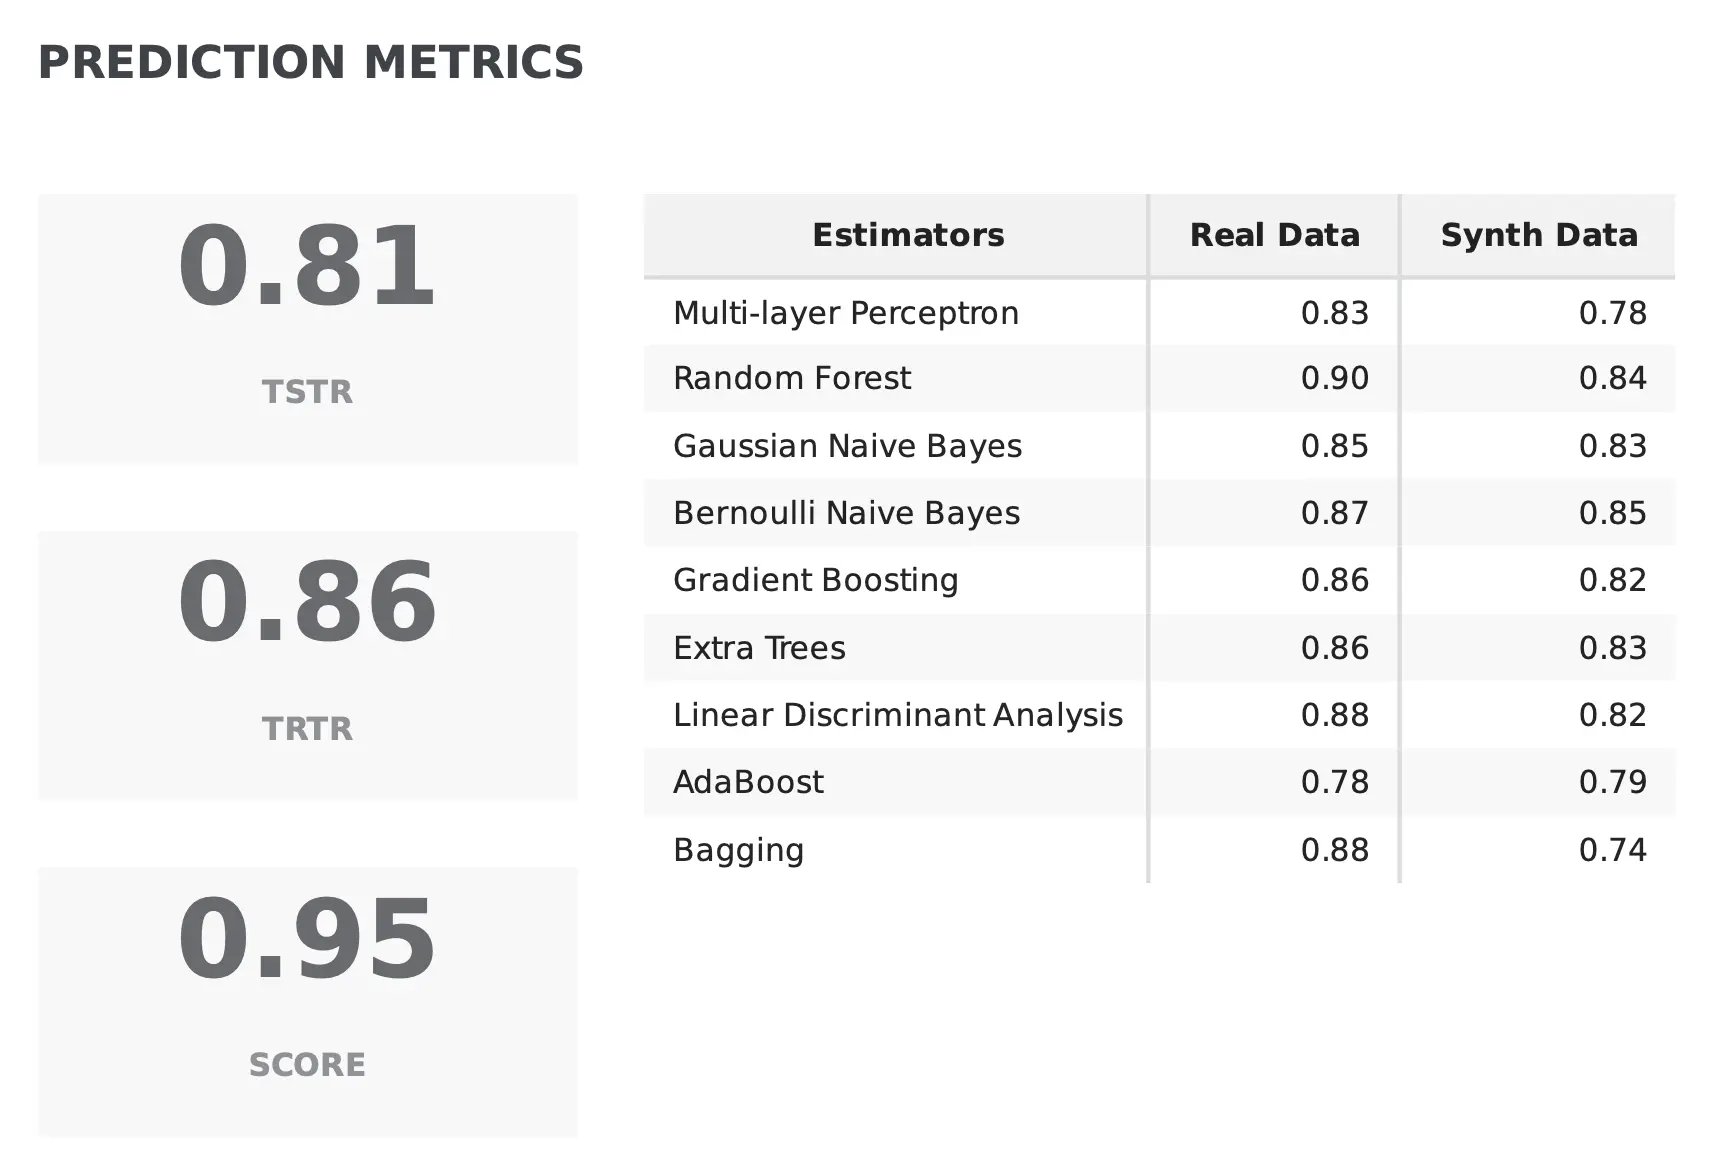
Fabric’s synthetic data quality report examines several prediction metrics to determine whether the synthetic data is able to replicate the predictions delivered by the real data, using a combination of the Train Synthetic Test Real (TSTR) and the Train Real Test Real (TRTR) scores.
In TSTR, machine learning models are trained on synthetic data, whereas in TRTR, models are trained on real data. Then, the trained models are evaluated on the same set of data from the original dataset. Both scores, ranging from [0, 1] are combined to produce a global score that computes the overall prediction performance of the synthetic data when compared with real data. A score closer to 1 indicates alignment between synthetic and real datasets.
In the example below, we can see that the synthetic data is apt to be used in prediction tasks since it holds 95% of the prediction performance of the real data. We can additionally zoom in on specific results from distinct classifiers to make a detailed assessment of how the synthetic data behaves with different learning paradigms:
How well does synthetic data reproduce the importance of my original features?
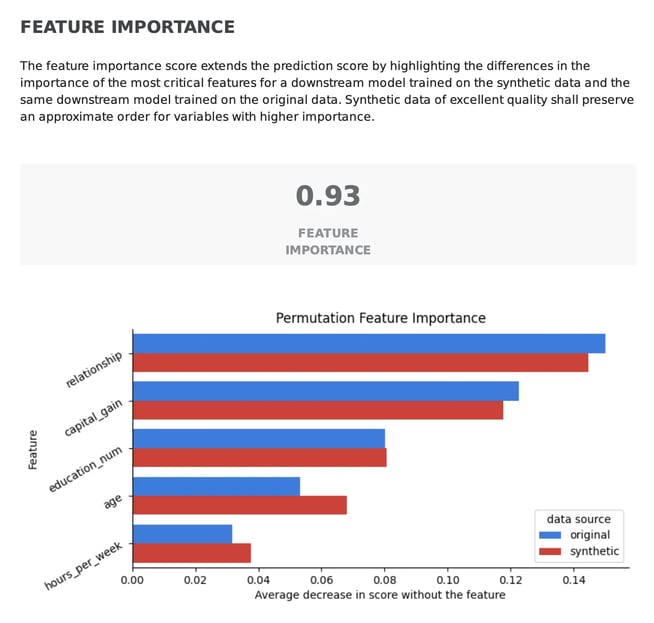
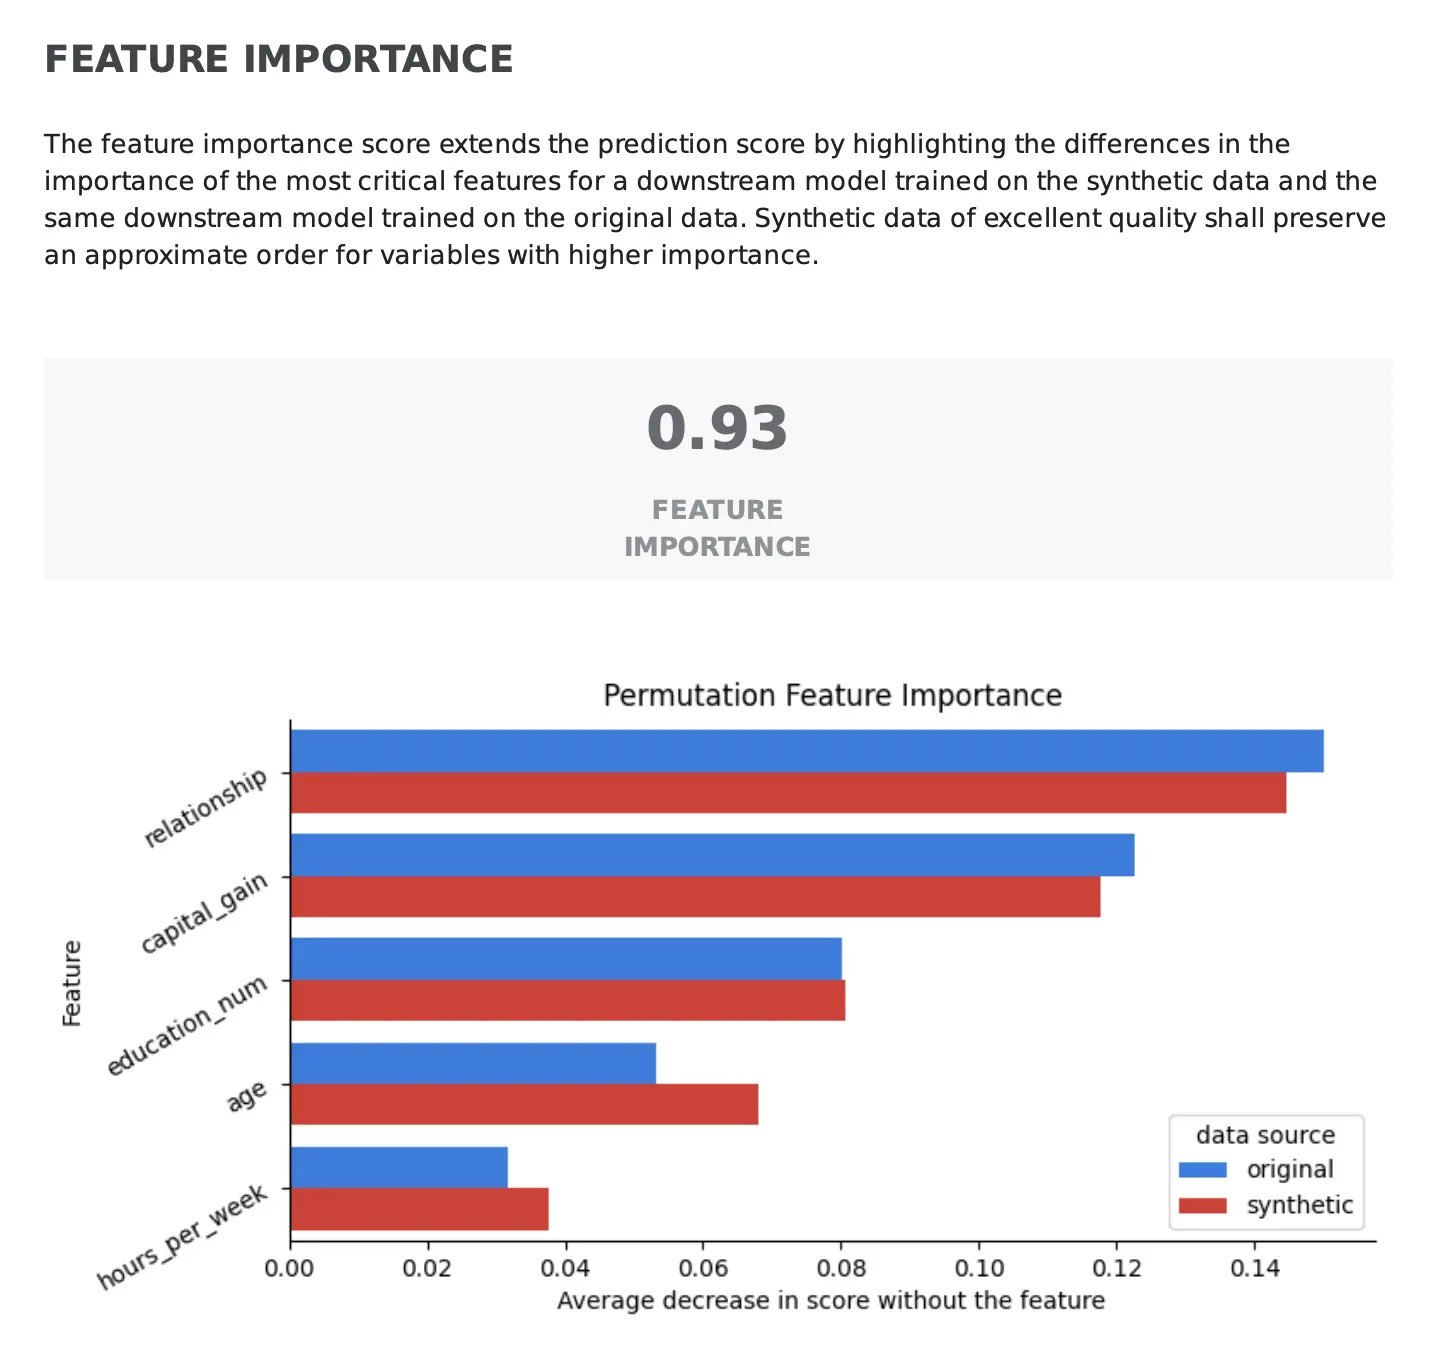
Beyond predictive alignment, ensuring that the predictive power of the individual features is kept is equally important for the reliability of synthetic data. The Feature Importance Score determines how well the synthetic data replicates the importance of each feature in predicting the target variable.
In the synthetic data quality report, the most critical features to predict the outcome of a task are compared across the real and synthetic data. High-quality synthetic data should preserve the order of importance of the features as found in the original data, leading to a higher score (closer to 1). In the example below, we can see how the order of the most important features is kept between the real and synthetic data, leading to an overall score of 0.93.
Conclusion
If you’re looking to accelerate AI development within your organization, Fabric’s synthetic data generation methods are ideal for increasing confidence in synthetic data for various use cases, such as model training and testing, and data-sharing initiatives.
Explore Fabric Community to dive into your synthetic data journey and don’t hesitate to contact us for additional questions or access to the full platform. You can also find additional materials at the Data-Centric AI Community and engage with other synthetic data enthusiasts.
