When generating synthetic data, it is key that new data mimics the distribution of the original data to ensure that the synthetic dataset is a realistic representation of real-world data. In that sense, evaluating how the synthetic data matches the real data is similar to comparing two datasets.
In a previous article, we focused on how synthetic data quality can be easily assessed with insightful visualizations and how Fabric enables a comparison between synthetic and real data regarding both univariate and multivariate components.
Going deeper into that evaluation, there are several statistical metrics and scores – both for continuous and categorical data – that can be used to quantitatively measure how close the synthetic data features are to the real ones.
In this article, we will explore how to interpret the univariate statistics used to compare the real data with the synthetic one, and how we can use them to assess the fidelity and how close the newly generated data is to the real data in terms of structure and behavior.
How close are my distributions?
A realistic and close representation of the distributions is fundamental for the quality of the generated synthetic data. Although it is easier to validate the distribution’s similarity from a visual perspective, it is even better if we can translate it into a measurable score.
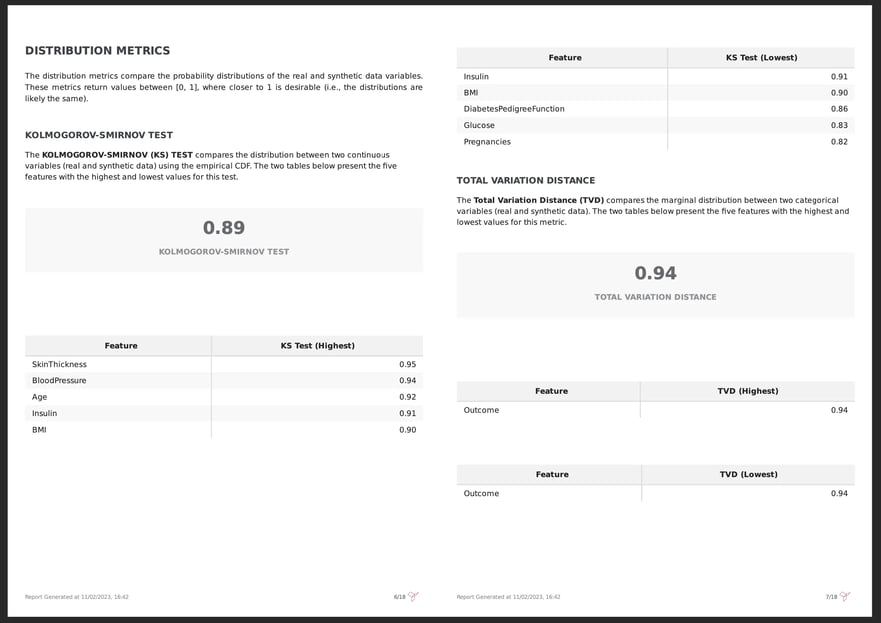
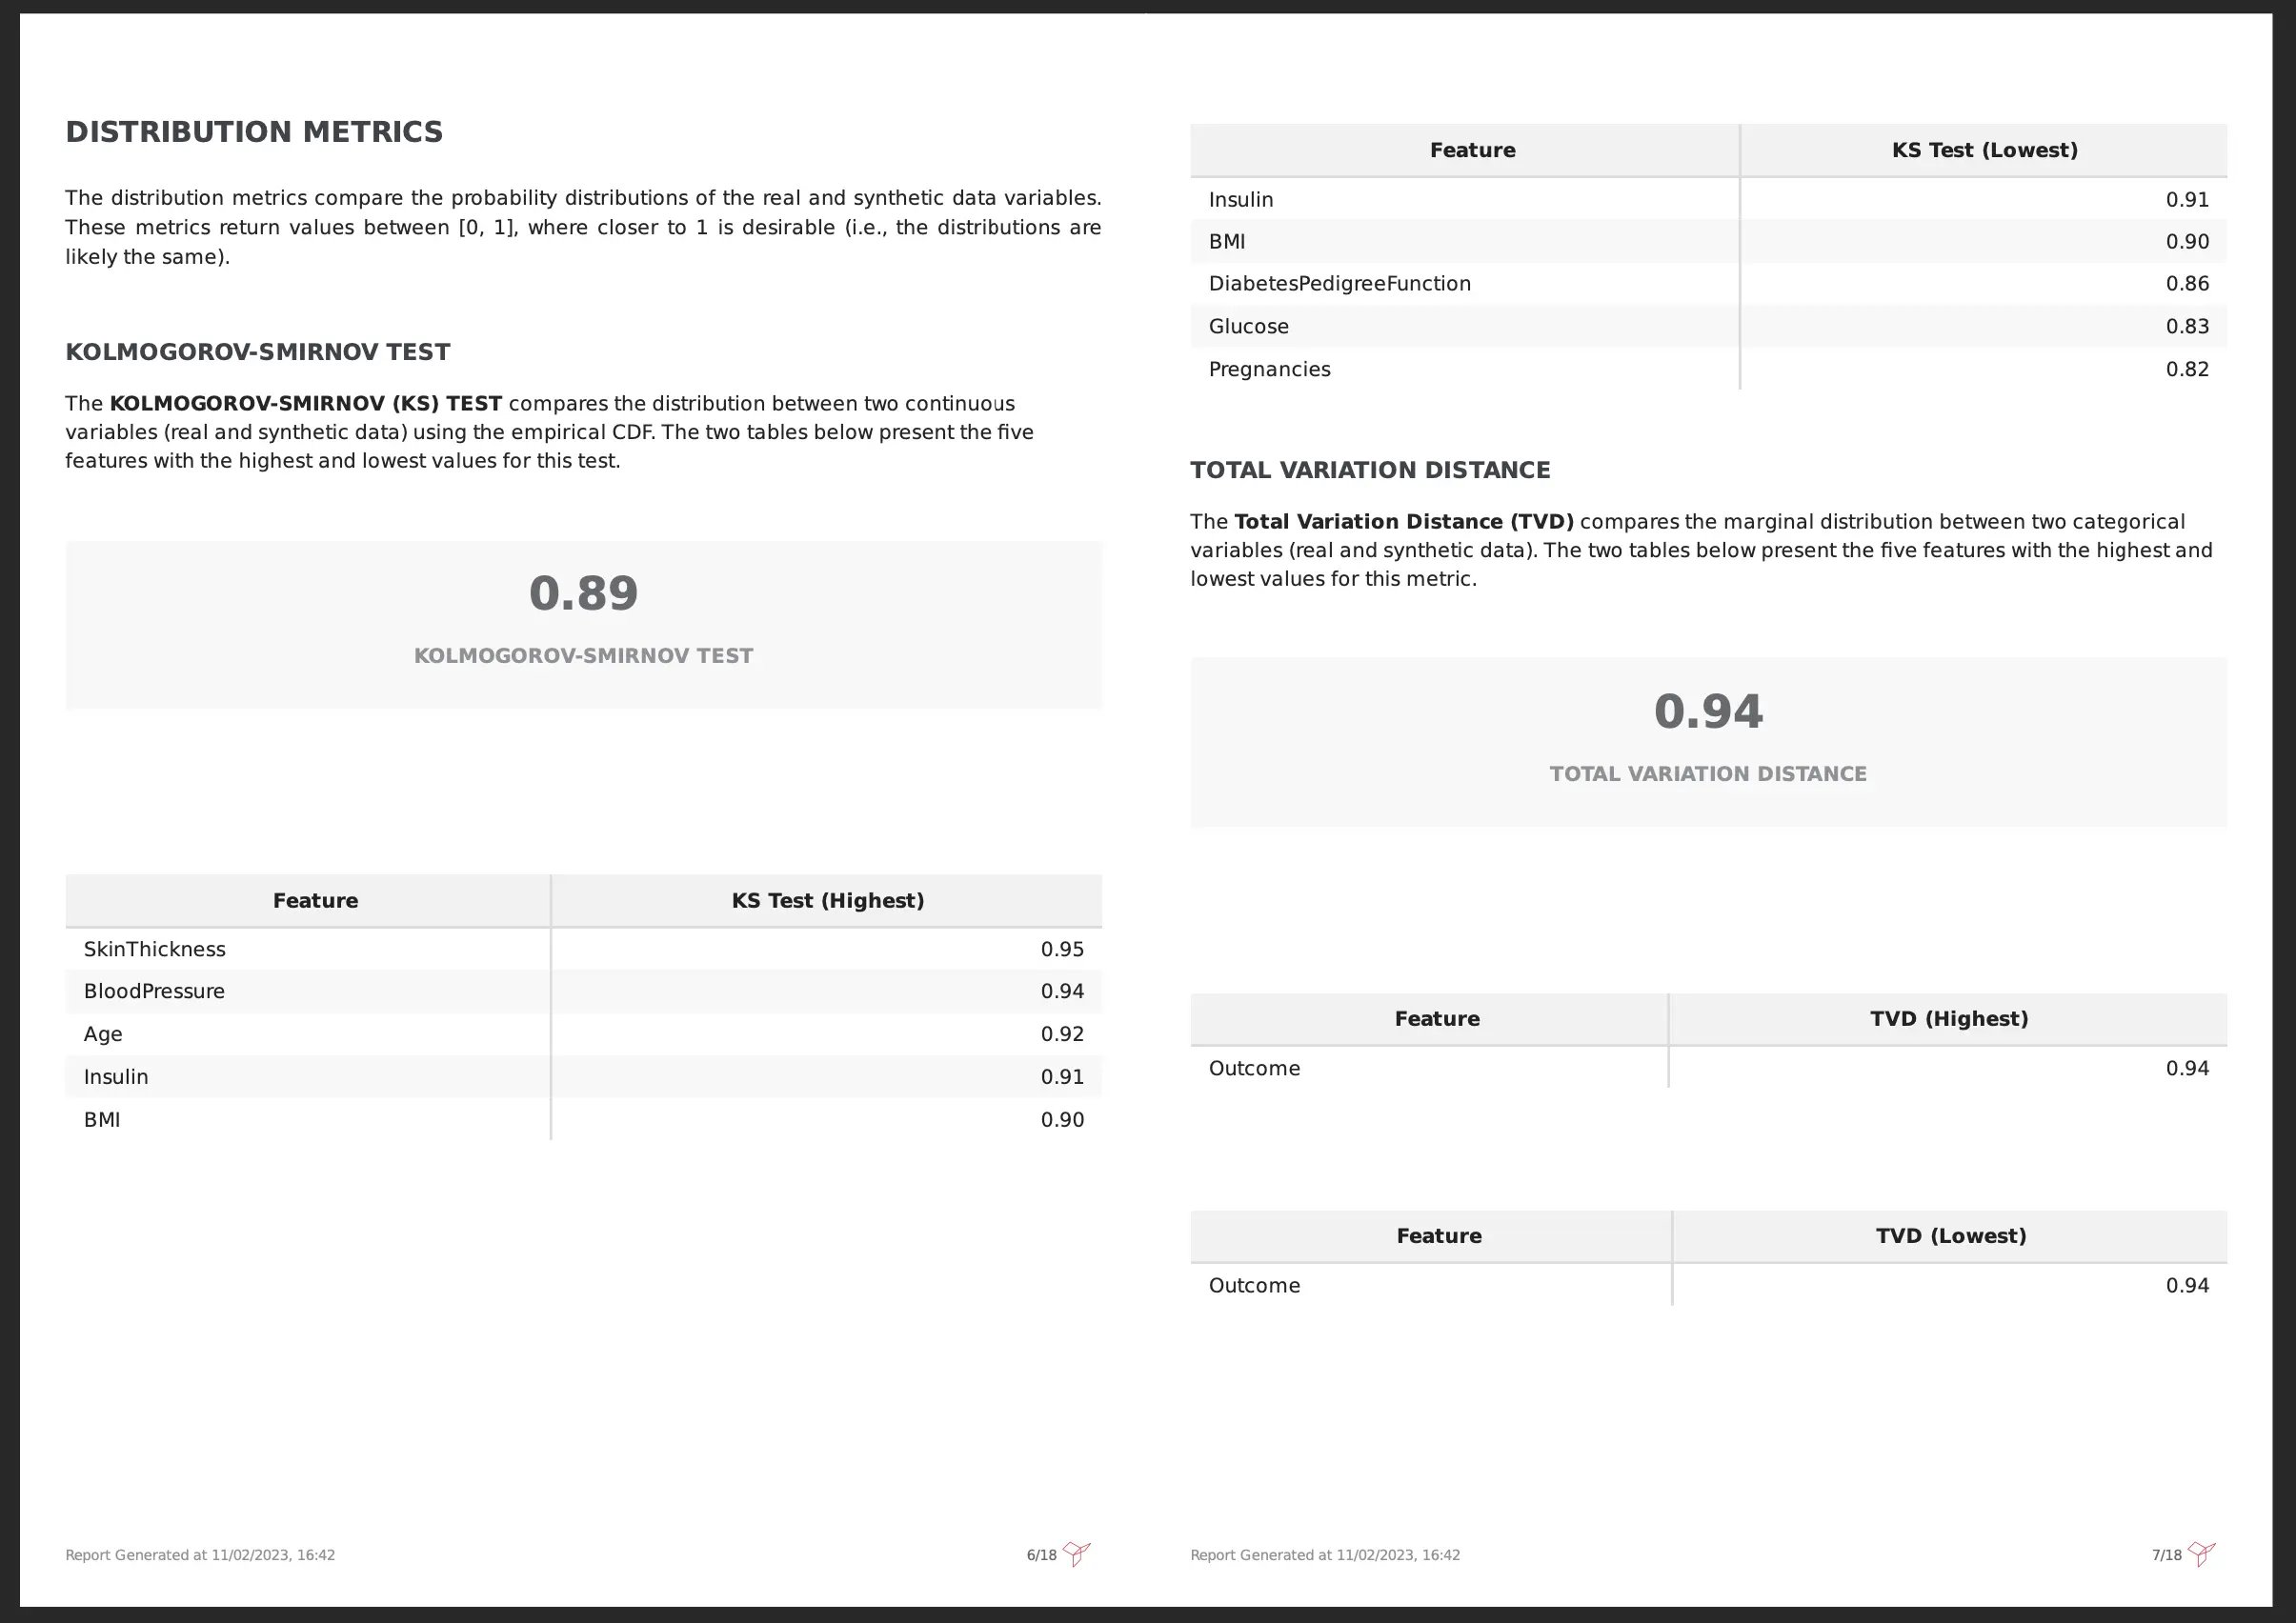
Jumping into the Synthetic Data Quality PDF Report, in the “Distribution Metrics” section, we can see that 2 scores are used to measure this similarity: Kolmogorov-Smirnov for continuous and date features and Total Variation Distance for categorical features. The output of both metrics is between [0, 1], and in both cases the higher the value, the closer the synthetic data is to the real data distribution.
In the example below, we can observe that the synthetic data is realistic when compared with the real data since the overall Kolmogorov-Smirnov and Total Variation Distance are high:
How good is my synthetic data coverage?
The distribution measures give us an overall idea of how close the synthetic data is to the real data. Nevertheless, there are other important measures that allow us to zoom in on certain aspects of the synthetic data.
For instance, How well-represented are our categories? Are there populations that have not been represented? Does my synthetic data cover the range of the original data (e.g., max and min values)?
This leads us to the “Coverage Metrics” section of the report. Overall, coverage metrics help us understand whether the synthetic data is skewed or limited in scope, ensuring a comprehensive understanding of its representation.
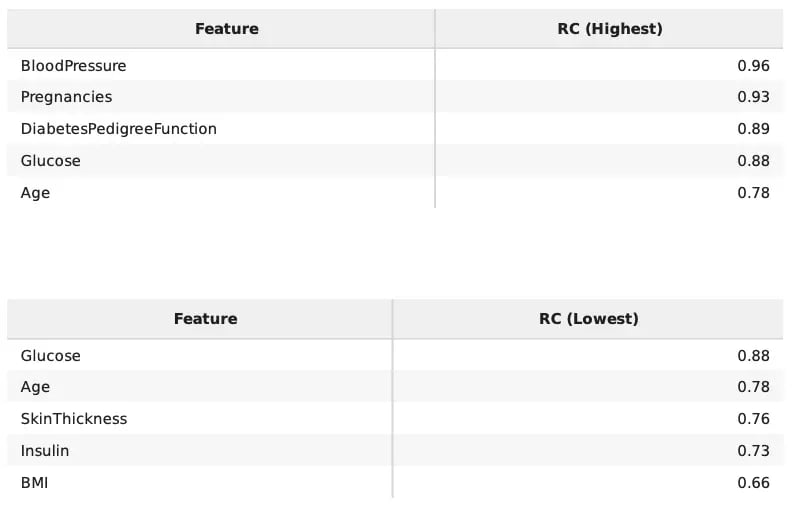
The 3 main coverage metrics considered are Range Coverage, which validates whether continuous features stay within the range of the real data, and Category Coverage combined with Missing Category Coverage which allows an understanding of the categorical features representativity in the synthetic data. All scores are bounded between [0, 1], where higher values indicate a higher coverage of the original values.
For example, in the image below we have the table with the results for the continuous data coverage metrics. The information is split into the top and bottom 5 scores for ease of interpretation. In this case, Blood pressure values are very close in terms of maximum and minimum values to the originally observed values. On the other hand, BMI is a bit less similar, even though it holds enough similarity -- this does not mean that the quality of the data is bad, it might for instance indicate that outliers were not included in the synthesis process.
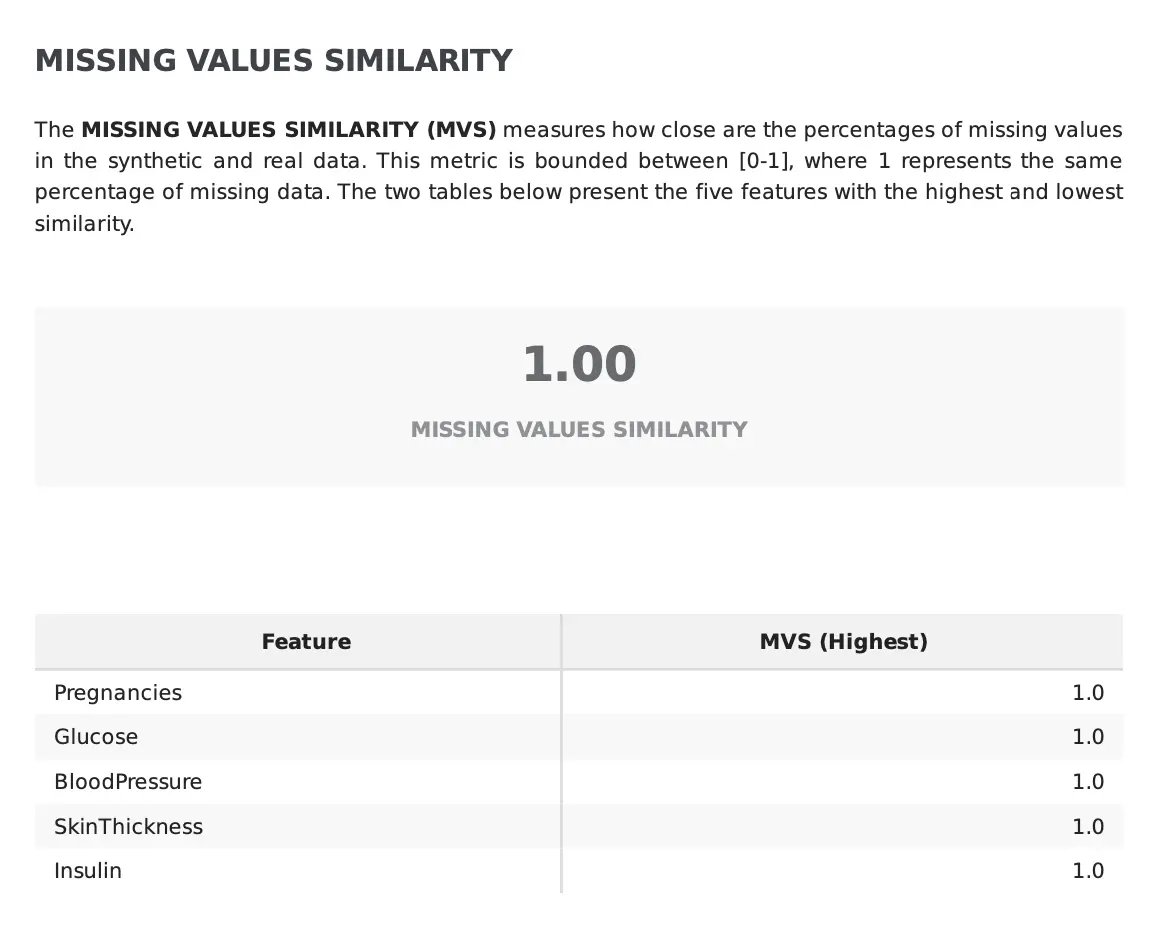
Are my missing values replicated?
Last but not least, missing data behavior replication in the synthetic data. By default, missing data behavior is also copied into the generated data as for some use cases we might be dealing with MNAR. For that reason, the Missing Values Similarity evaluates how well the synthetic data captures the missing data patterns observed in the original data. The values are bounded between [0, 1] with scores closer to 1 meaning that the missing data behavior is similar in both datasets.
Conclusion
Since synthetic data should accurately mimic the properties of real data, it is important to thoroughly examine the univariate characteristics observed in each feature of the newly generated data, to guarantee that their distribution and coverage are kept.
Fabric automates this assessment by returning a set of scores that map how faithfully the synthetic data replicates the properties of the original data. If you’re embarking on the synthetic data generation journey within your organization, Fabric Community Version is the best place to start.
We invite you to learn more about how Fabric assesses synthetic data quality and to contact our specialists for additional questions.
Feel free to join us at the Data-Centric AI Community for additional resources and to network with other data professionals.