Unveiling the inner workings of how sequential data works and how Fabric can to smooth your journey in a time-series Machine Learning project
Time-series data refers to a type of data that is collected and recorded over time and can be found in various applications, such as daily stock prices, hourly temperature measurements, monthly sales figures, or daily website traffic statistics. The key characteristic of time-series data is precisely its temporal nature. While for tabular data we typically assume independence between different records, in time-series data measurements evolve through time.
Time-series data structure
The essential differences between time-series data and tabular data, therefore, lie in their structural organization and the inclusion of time-related information.
Time-series data is structured sequentially, with observations ordered chronologically based on their associated timestamps or time intervals. It explicitly incorporates the temporal aspect, allowing for the analysis of trends, seasonality, and other dependencies over time.
In contrast, tabular data is organized in rows and columns, with each row representing an independent instance and each column representing a different attribute. It lacks an inherent time component and focuses on cross-sectional analysis rather than temporal patterns.
In essence, time-series data incorporates the following dimensions:
- Variables that give the order of time
- Variables that refer to entities
- Variables that are attributes
- Variables that are time-variant
Consider the following example, which simulates money transactions from a department in a financial institution:
| Date |
Account Number |
Type of transaction |
Account balance |
| 2023-05-01 |
123466 |
WITHDRAWAL |
$2500 |
| 2023-05-02 |
123466 |
DEPOSIT |
$2523 |
| 2023-05-03 |
123466 |
WITHDRAWAL |
$2468 |
Our example includes the following components:
- Date: The variable that references time. It represents the specific date when the transaction occurred;
- Account Number: Refers to the account of origin or destination of the transaction.
- Type of transaction: Attributes that characterize the transaction - withdrawal or deposit. In this case, they provide more information about the type of transaction that was made;
- Account balance: the time-variant variable of the dataset that represents the account balance throughout the different transactions.
Understanding the structure of time-series data and identifying its properties is crucial for several machine learning tasks, from feature engineering to model design and synthetic data generation. Let’s dissect these properties in more detail.
Time-series data structure
Variables that encode time in a time series dataset are used to represent the temporal aspect of the data. These variables provide information about the order, duration, and relationship between data points. Some common variables that encode time include the timestamp, date, month, season, quarter, or even week.
In the example above, the variable Date represents a higher-level view of a temporal sequence, including year, month, and day. That is an example of a simple variable that gives the order of time, although it is possible to have composed temporal information:
| Date |
Time |
(...) |
| 2023-05-01 |
08:12:00 |
(...) |
| 2023-05-01 |
09:36:56 |
(...) |
In the example above, the variable that defines time can be defined by combining multiple variables (Date and Time) to capture more detailed temporal information. Composing the time variable might be necessary when dealing with complex or granular time-related data and depends on the specific needs and nature of the dataset. By combining multiple time-related variables, it is possible to capture and analyze temporal patterns at different levels of detail, enabling more comprehensive insights into the data. Finally, note that the order of time can also be given by an index, as long as the associated information has a temporal relationship and an underlying order.
Variables that are time-variant
Time-variant variables vary over different points in time. They capture the dynamics, fluctuations, and patterns that occur as time progresses, reflecting the evolving nature of the phenomenon under observation.
In our example, Account balance is the time-dependent variable:
| Date |
Account balance |
| 2023-05-01 |
$2500 |
| 2023-05-01 |
$2523 |
| 2023-05-02 |
$2468 |
Other examples include stock prices, humidity or precipitation levels, energy consumption, or sensor data. Depending on the context, these variables may fluctuate continuously over different time periods, such as weeks, days, or even by the hour.
As these variables change over time, they can predict certain trends as time goes by. Trends can be as simple as increasing or decreasing patterns, or reflect more complex behaviors such as periodicity (patterns that repeat over time) and seasonality (fluctuations tied to specific seasons, months, or other recurring time periods).
Variables that refer to Entities
Time-series data can refer to single or multiple entities by tracking and recording observations or measurements associated with those specific entities over time. This is done by including an identifier, name, code, or any other label that uniquely identifies the entity within the dataset.
An entity represents a distinct object, person, or concept that is considered separate and unique in the domain. Entities typically have their own identities (attributes) and can be the subject or object of actions or interactions.
For instance, in a time-series dataset that represents our money transactions, the Account Number can be considered an entity, as identifies the account from where the money was moved from. On the other hand, as the Type of Transaction varies with the transaction itself, it should be considered as an attribute that varies with time.
| Date |
Account Number |
Type of transaction |
Account balance |
| 2023-05-01 |
123466 |
WITHDRAWAL |
$2500 |
| 2023-05-02 |
123466 |
DEPOSIT |
$2523 |
Beyond IDs or Account Numbers, other identifiers can include entity names or codes. For instance, in financial data, a company code or name may identify the stock prices of a specific company over time. In the context of IoT, various sensors can also be associated with a specific hash code.
Overall, incorporating a unique identifier or label for each entity, allows time series data to be structured to represent and analyze the behavior, patterns, and trends specific to that entity. This allows for entity-centric analysis, comparison, and evaluation, providing insights into the individual entity's dynamics and characteristics over time.
Variables that are Attributes
In the context of time-series data, attribute variables refer to variables that describe specific characteristics or properties, they can either vary with time (in case they refer to the event) or to the entity of the series (in this case they don’t vary with time).
From our initial example, we have the Type of Transaction variable, as it varies with time or in case with the lowest granularity of our series, the transactions, this variable can be considered as being an attribute of the Transaction itself.
In the example below we added a new variable, Branch, which constitutes an attribute that characterized the main branch for the account from which the transactions were made. Other attributes associated with the Account Number could be the type of account, the plan associated with the account, the owner, and so on:
| Date |
Account Number |
Branch |
Type of transaction |
Account balance |
| 2023-05-01 |
123466 |
Maddison |
WITHDRAWAL |
$2500 |
| 2023-05-02 |
123466 |
Maddison |
DEPOSIT |
$2523 |
Your guided journey into time-series data with YData Fabric
Fabric is a Data-Centric workbench for developing Data Science focusing on structure data: tabular, time-series, and relational databases.
The solution provides everything you need for your Machine-Learning project with time series, from profiling to synthetic data generation.
Because the data profiling and quality checks typically involve examining behaviors such as trend, seasonality and cyclical patterns, as well as auto-correlation, Fabric’s data catalog includes a profiling report that was specifically developed for time-series datasets. Time-series data profiling can help identify patterns, detect outliers, determine seasonality effects, and reveal important temporal dependencies.
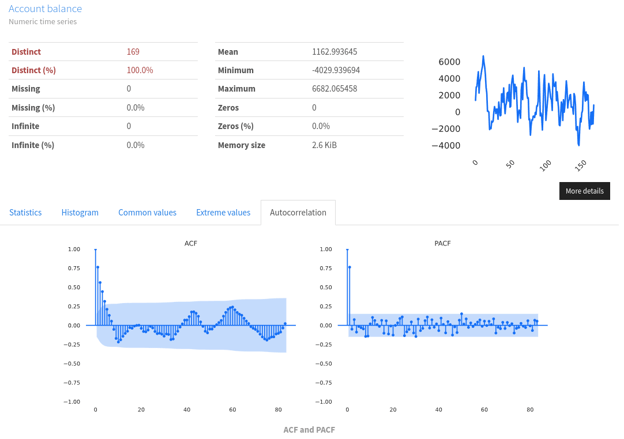
Plot of the exploratory data analysis for the account balance variable (the dataset depicted was generated with numpy and scipy stats distributions)
Because the time-series structure impacts your downstream applications, like analytics or even Machine-learning based projects, Fabric ensures that you can correctly map your business knowledge of your time-series dataset into the different modules, including time-series synthetic data generation. Leveraging the metadata of your data, you can easily configure inputs such as the time order of your data (Sort by key) and distinguish between what are the entities (Entity input, in case you have a multi-entity set) and the time-variant properties.
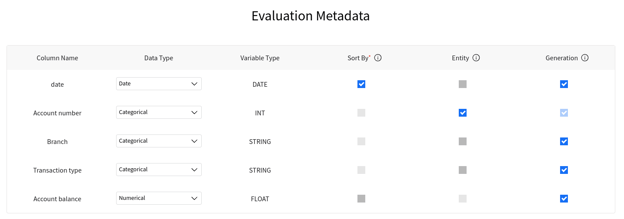
Configure your time-series metadata for an optimal synthetic data generation process
Time-series datasets are very rich in dimensions, so there are always trade-offs and best practices to consider while working with them, including creating synthetic data.
The journey into the world of sequential data is fun and rich in new learnings on how the data behaves and how you can prepare your data. In the next blog post we will be covering other time-series properties that you such be familiar with such as seasonality, periodicity and trends.
Try the YData Fabric community version and start your journey with time-series synthetic data generation today, or contact us for trial access to the complete platform.
Cover Photo by Agê Barros on Unsplash