Cover Photo by Agence Olloweb on Unsplash
In the fast pace of today’s data-driven world, synthetic data is becoming an important resource of data projects across industries. Automated decision-making systems in healthcare, algorithmic trading, fraud detection, telecommunications, transportation, e-commerce, and beyond can all benefit from synthetic data.
But as with real data, pairing synthetic data with data quality takes your project to the next level.
What is Synthetic Data?
Instead of being collected from real sources, synthetic data is artificially generated by a computer algorithm.
In this sense, “synthetic” data does not correspond to actual activities in the real world. Instead, it’s generated with attention to the properties and characteristics of the real data, closely enough that the synthetic data reproduces the same behavior and insights that real-world data would produce — thus meaning that the synthetic data holds real data value.
Synthetic data generation can take many forms: simpler processes include sampling from a statistical distribution adjusted to the data, using well-known oversampling techniques like Synthetic Minority Oversampling Technique (SMOTE), or considering more refined methods like Variational Autoencoders (VAEs) and Generative Adversarial Networks (GANs).
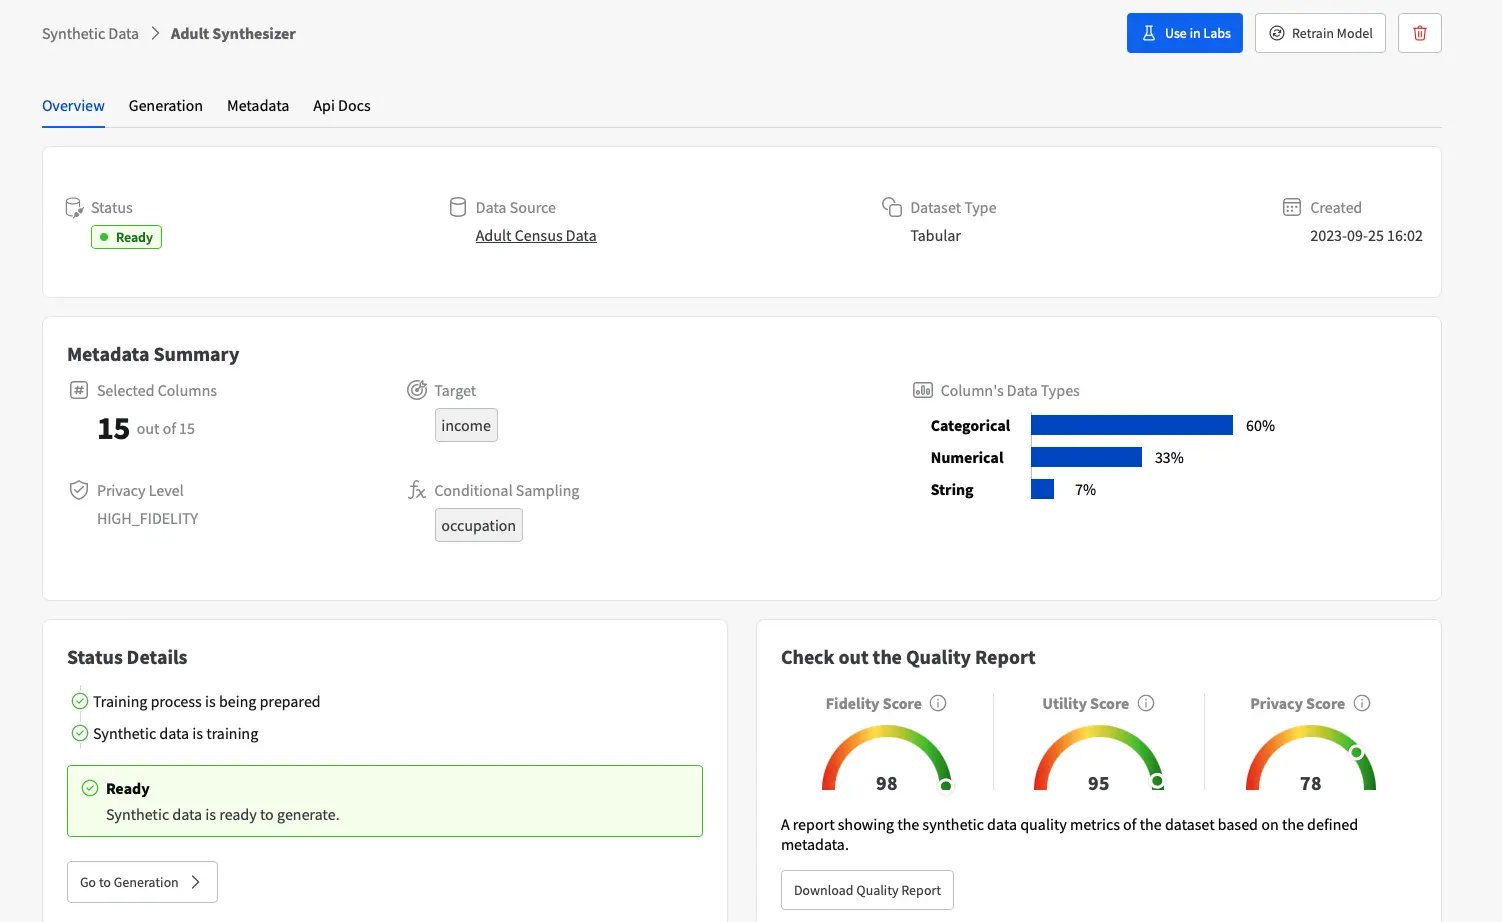
YData Fabric
Fabric offers a user-friendly experience of synthetic data generation for both technical and non-technical users, allowing data teams to overcome the challenges associated with data collection, data sharing, and data quality. Its flexible synthesizers enable us to create smart synthetic data that matches our needs, whether it is tabular, time-series, or data stored across relational databases.
In this article, we will explore the free Community Version and leverage the Conditional Sampling functionality since we will be using synthetic data to increase the representation of a sub-represented category in our original data. Using a synthesizer that was trained conditionally, we can adjust the distribution of the newly generated data with respect to the conditions we need. Therefore, conditional sampling is perfect for de-bias, augmentation, and balancing use cases.
What is Data Quality?
If you’ve made it to the point of considering synthetic data, you’re likely already familiar with data quality. But as a quick review:
- Data quality (noun) is the degree to which your data is free from factual errors and otherwise meets your expectations: how much is there? When is it arriving? What is it describing? It’s a multifaceted evaluation that requires both technical and business-context knowledge to describe.
- Data quality (verb) is the process of describing what you expect your data to look like, and then identifying if your data meets those expectations. This also requires both technical understanding of your data’s origins and downstream destinations, and business knowledge of your data’s operational and analytical uses.
Great Expectations
GX is the leading open source platform for data quality, and the core concept of its testing is the Expectation. As the name suggests, an Expectation describes what you expect from your data: the basic core concept of data quality. Expectations can look at many different aspects of the data, including statistics, actual values, schema structure, and row counts.
Expectations offer you a ton of control and flexibility in your testing, along with complete transparency into their operation. This is especially critical in scenarios like preparing data for use with AI or to reduce bias, where it’s essential that you are able to examine and explain every bit of your data pipeline.
Over 300 Expectations are available for immediate use in GX’s Expectation Library. You can select these Expectations manually and/or use a Data Assistant to suggest some appropriate Expectations and their configurations. You can also create Custom Expectations. By grouping your Expectations into Expectation Suites, you create a set of assertions about the expected state of your data that you can apply to any data source you connect to GX.
Results of your GX data quality are automatically generated as Data Docs, which include human-readable descriptions of your Expectations. You can use Data Docs to collaborate with non-GX users and nontechnical users about the results of your testing, making sure all stakeholders are able to understand and participate in the creation of your Expectations.
And because Data Docs are generated automatically, it’s easy to keep everyone on the same page about what tests are being run.
Data Augmentation with Synthetic Data + Data Quality
One important use case for synthetic data is augmenting training data for ML models. If a model doesn’t have enough examples of a particular profile, it won’t learn to recognize it. Some examples:
- In finance, to detect credit card fraud you need to have enough fraudulent transactions represented among the legitimate ones in your training data.
- In healthcare, to detect a rare disease you need to have enough patients with that disease in your training data.
- Also in healthcare, to detect conditions in populations that are under-represented or under-diagnosed due to social biases or particular constraints of the data collection process, you need to have enough patients in the relevant demographics or characteristics in your training data.
In all of these cases, "get more real data" is often not an option: you’ve already gotten all the real data it’s possible to get.
But rather than train your ML on data you know is inadequate, you can use synthetic data to augment your dataset, after you use data quality to find out whether -- and how -- your initial data is inadequate.
Enter GX + YData Fabric.
Tutorial Example
In this example, we’ll use occupational data from the Adult Census Income dataset, available in Kaggle under the CC0: Public Domain License. We’ll treat machine operators/inspectors as our potentially underrepresented population of interest: we need at least 10% of our records to have the “Machine-op-inspct” occupation or our model won’t learn what we want it to.
Setup
The first step is to create a virtual environment and install great-expectations to validate our initial assumptions about the data:
Validate initial data
We start by importing the great_expectations module, creating a Data Context, and connecting to the original data:
Now, we can define our Expectations. We can write as many Expectations as we need to properly assess our data: in our example, we want to guarantee that at least 10% of records in the “Occupation” feature have the “Machine-op-inspct” category. To set this expectation, we can use the “expect_values_to_be_in_set” Expectation to validate our assumption:
After defining the checkpoint, we can determine whether the data validation has been successful and launch GX’s Data Docs to see the results as an html file:
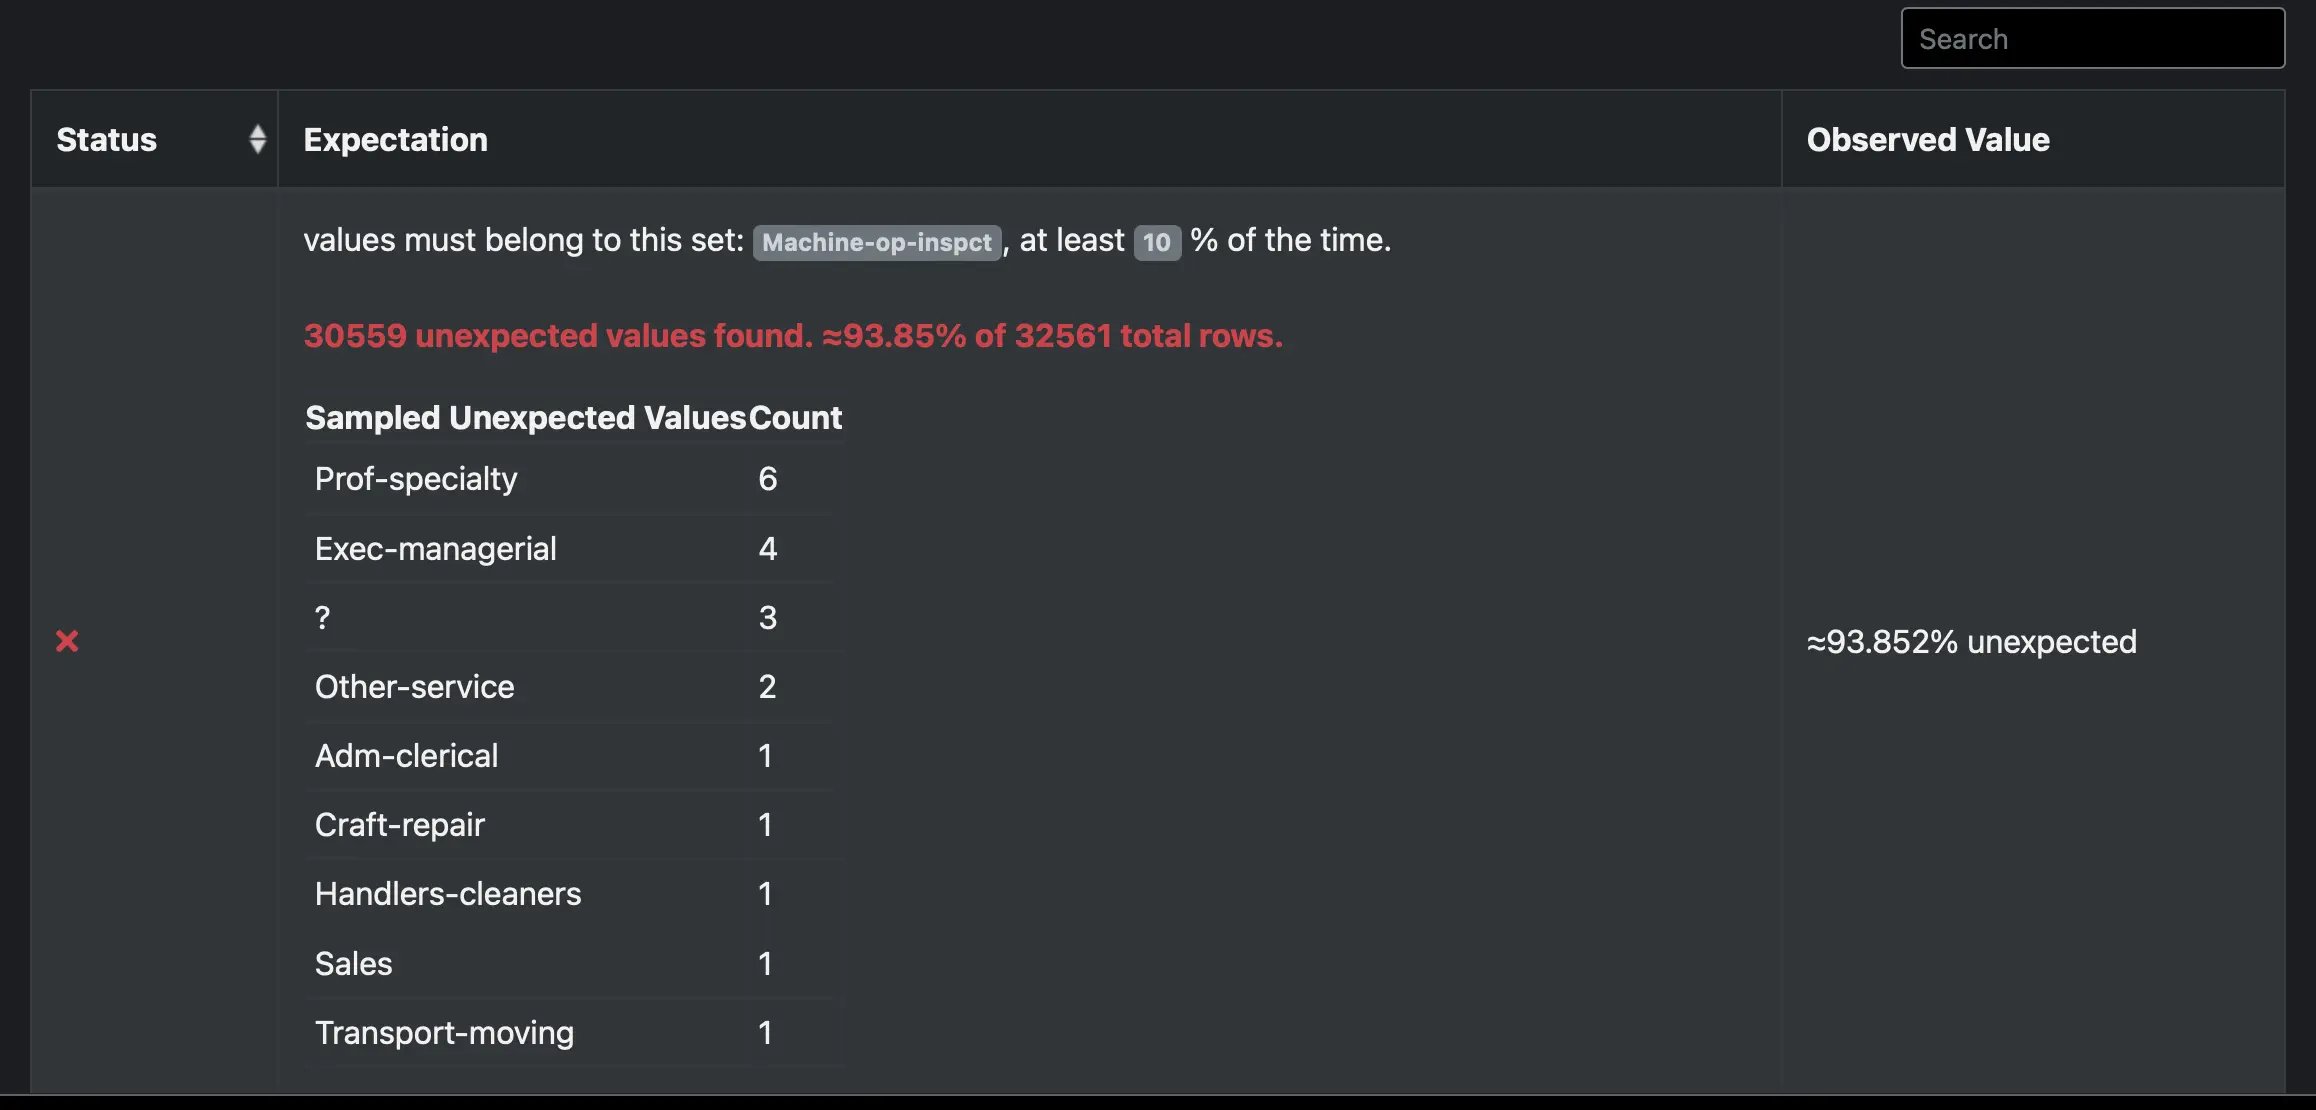
Looking at the results, we find that “Machine-op-inspct” is only present in 6% of records. This is much less than we want; we need more “Machine-op-inspct” records.
This is where YData Fabric comes in.
Create augmentation data
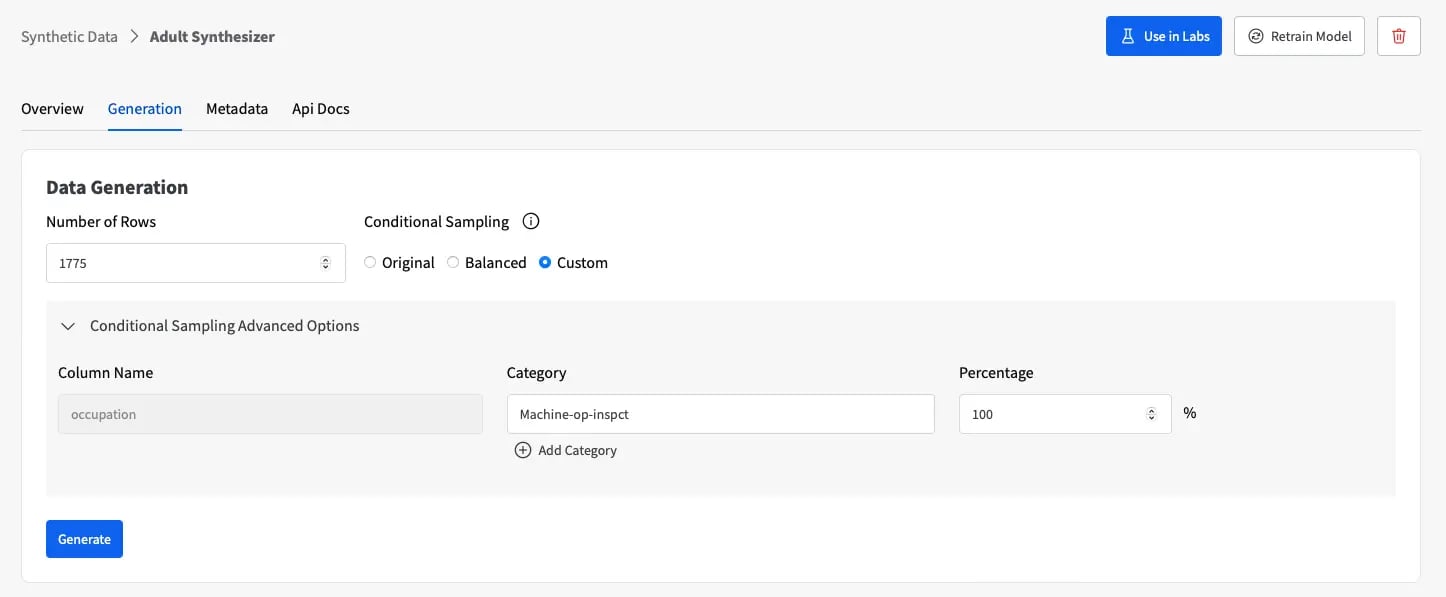
Using Fabric Community Version, we can easily specify that we want to generate more records with the “Machine-op-inspct” occupation. For that, we can leverage the Conditional Sampling functionality, which allows us to constrain the generation of new synthetic samples to this pre-defined category.
In essence, conditional sampling will guide the generation of new data based on a specific characteristic that we wish to control. First, we need to specify the feature that we want to condition on (i.e., “Occupation”). During the training stage, the synthetic data generation model will learn the joint distribution of all the other remaining features with respect to this conditioning feature.
Then, in the sampling stage, the model with be able to create new artificial records whose data characteristics match those of the original data with the condition we’re interested in.
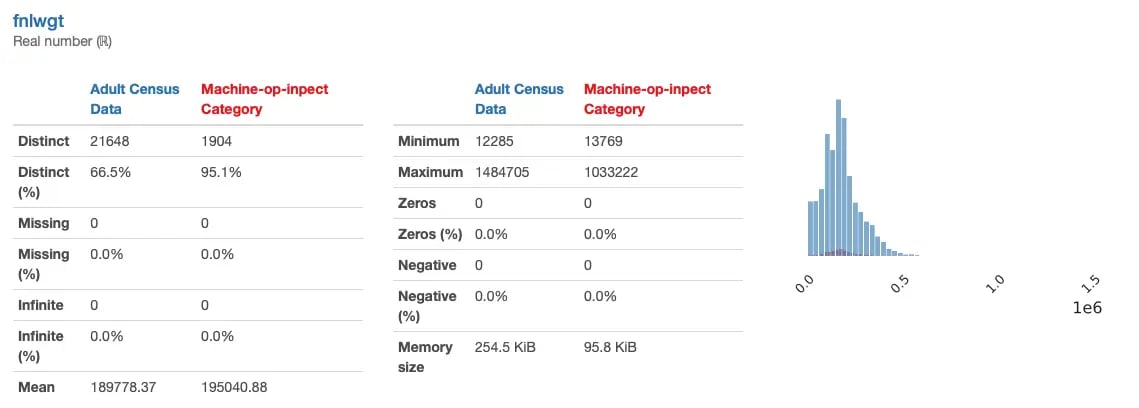
Here’s a comparison of the “fnlwgt” feature between the original data and the “machine-op-inspct” category:
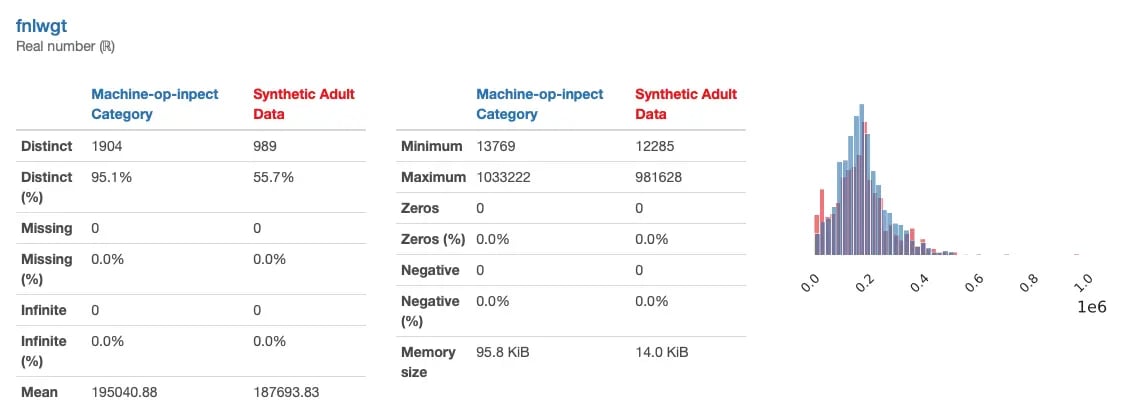
Using conditional sampling, we can condition the generation of new synthetic “fnlwgt” data that matches the particular characteristics of the “machine-op-inspct” subgroup:
To leverage Conditional Sampling, the first step is to load our dataset into Fabric’s Data Catalog. From there, we can access the Synthetic Data functionality and get started with our smart synthetic data generation.
We need to create a new Synthesizer and define the conditional sampling settings to consider the “Occupation” feature. In our example, we’ve also optimized the privacy level for “high-fidelity” to guarantee that the new artificial data is as close as possible to the original data.
Once the synthesizer has learned the data characteristics of the original data, we can generate as many synthetic records as we want, and condition the generation to our specific needs. To oversample the “Machine-op-inspct”, we just need to condition the sampling process to this category, using a custom generation where 100% of new samples will belong to it:
With this synthetic data, we should now have our population of interest represented at least 10% of the time. We can download the synthetic data as a CSV from Fabric, add it to our original data, and confirm that everything is correct with GX.
Validate the augmented data
Finally, we can rerun the same GX checks on the augmented data to confirm that machine operators/inspectors are represented at adequate levels:
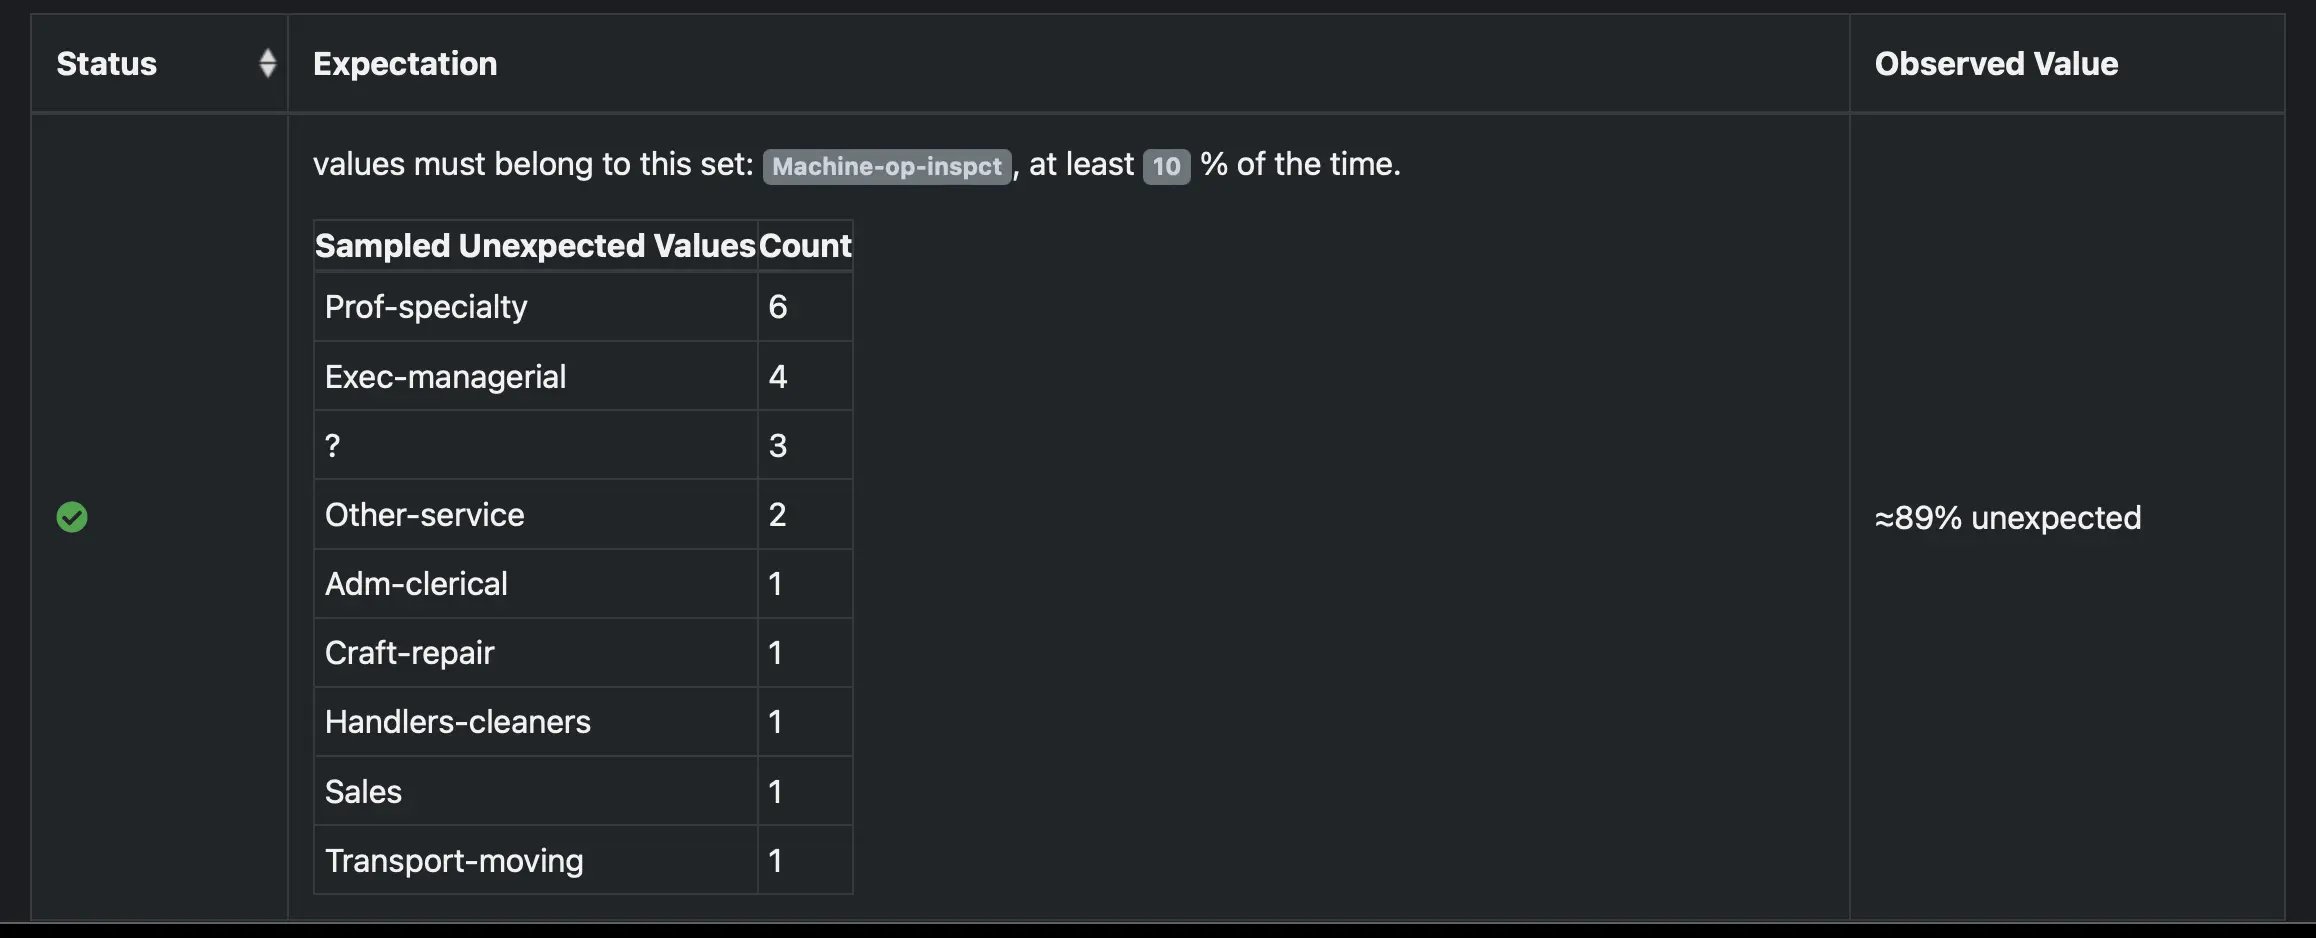
The “Machine-op-inspc” category now amounts to 11% of the “Occupation” feature in the synthetic augmented data. With this successful evaluation, we’ve confirmed that strategically using synthetic data has allowed us to create a dataset that adequately represents our population of interest, and we can be confident that the ML model will learn to account for that population.
Final Thoughts
Creating accurate synthetic data isn’t a one-and-done proposition. It demands an iterative, continuous examination and improvement of the data processing and generation processes.
There are a lot of factors to consider—intended use case, the data’s sample size and feature size, whether the data is tabular or time-series, and the domain itself being some of the most important ones to consider.
For that reason, it’s crucial that we keep evaluating our synthetic datasets constantly throughout the process, which can be very time consuming and error prone. Luckily, using YData and GX makes this much easier.
With GX, you can continuously generate data quality reports for each new set of synthetic data. Using those results, you can identify where your synthetic data is falling short of what you need.
Since YData Fabric makes it straightforward to keep regenerating your synthetic data, its combination with GX is extremely powerful for iterating on your synthetic data until you’re confident in the final result.
Pretty sweet, right?
Even if you’re a beginner to synthetic data, using GX and Fabric is a straightforward process. If you have questions about improving your synthetic data quality, fine-tuning your models, or creating more complex Expectations, come check out our community spaces:
Don’t hesitate to jump in: we’re excited to meet you and learn about what you’re planning!