
10 min read.
Community Revamp
Introducing the new Data-Centric AI Community on Discord
AI development is indeed a bitter-sweet road: we love the potential, but hate the data quality issues.
If you’re a data scientist, you’re probably nodding your head “Yes!” and thinking that time passes excruciatingly when rather than focusing on what matters most — insights and forecasting — you are bending over backward trying to get high-quality data to feed your models.
Defining “high-quality” data, however, is a conundrum with numerous nuances because it depends on several factors:
The application/domain you are working with;
The amount of data that is available to train your models;
The endgame/objective, the definition of success for your application, and of course, the constraints you may have when operating with real-world domains.
If you’d like to go down the rabbit hole, browse through the DAMA’s Research Paper on Dimensions of Data Quality. Spoiler alert: they discuss over 100 dimensions and establish about 60.
Now, going beyond these overarching dimensions, we need to get more technical and talk about data quality from the perspective of a data scientist.
In a nutshell, these questions will come down to diagnosing potentially critical data quality issues (or general data characteristics) that may compromise the operations of the machine learning models or their performance throughout the whole data science lifecycle.
And what are they?
Do I have missing data? How does my missing data behave?
Are all instances labelled? Are they trustful?
Are these features consistent and informative?
Do I have enough data to train my model?
Are concepts equally represented in data?
Is my data noisy?
As standard machine learning algorithms expect their input to follow a few assumptions on the data (e.g., representativeness, completeness, consistency), these questions need to be addressed even before considering building a model.
This is where profiling your data through and through is a required step in every data science project, and one that will save you a lot of time and heartache.
Data Profiling is precisely this step of diagnosing your data.
Think of it as performing a regular checkup to your data to see if everything is “good to go” for model building, or if there is something that needs to be handled properly first.
A standard way of profiling your data is through Exploratory Data Analysis (EDA). This involves a deep exploration of the data, trying to understand its intricacies and properties as fully as possible, namely through:
Dataset Overview and Characteristics: Determining the number of features and observations, types of features, missing values, duplicate records;
Univariate Visualization and Feature Assessment: Analyzing descriptive statistics such as distribution, range, variation, scale, common values, missing values, possible outliers, and evaluating the need for re-indexing, reformatting, or remove values as well as other operations such as data imputation or augmentation;
Multivariate Visualization and Correlation Assessment: Investigating patterns and relationships between features, behavior or missing values, and assessing the need for dimensionality reduction and feature selection.
This is a thorough and crucial step in the data science lifecycle, but a very-time consuming one as well. It’s an intimidating process for anyone who is not a trained data scientists, and even for data scientists, it might be difficult to know where to look precisely.
And there’s another quirk to it: without systematic processes and tools, the success of EDA gets highly dependent on the expertise and experience of the person conducting the analysis.
Knowing what to look for is difficult, and an inappropriate EDA may push you back in time months or years in your project (if not compromising it altogether).
This is a giant responsibility, especially given that this is an iterative process, error-prone, with ever-changing requirements, thresholds, and constraints as the model is deployed to production. Oh, yes… did I forget to mention that?
As the new Data-Centric AI paradigm is extensively advocating, data profiling must become a standard, systematic, iterative, continuous, and automated process performed at each step of data analysis pipelines.
And that’s what great software is for.
Having reached an outstanding milestone of 10K stars on GitHub just this week, the data science community has praised Pandas Profiling as the top open-source tool for data profiling.

And no wonder why.
First, it is dead simple to use: with just a few lines of code, we can automatically create HTML or PDF reports with summary statistics and visualizations that enable us to swiftly gather the main characteristics of our data.

Secondly, its simple and friendly interface can be used by technical or non-technical staff to effectively communicate and discuss trends and insights.
Well, the current version of Pandas Profiling now comes fully flavored with three major updates that put it in the top of EDA packages out there:
Automatic generation of data quality alerts;
Support for tabular and times-series data;
And of course, enabling comparison reports.
These are definitely killer features for data scientists: they empower them to identify quality issues and automate quality checks, address the two most common types of structured data, and iteratively assess data transformations and operations performed during the data preparation pipeline.
Let’s take them one at a time?
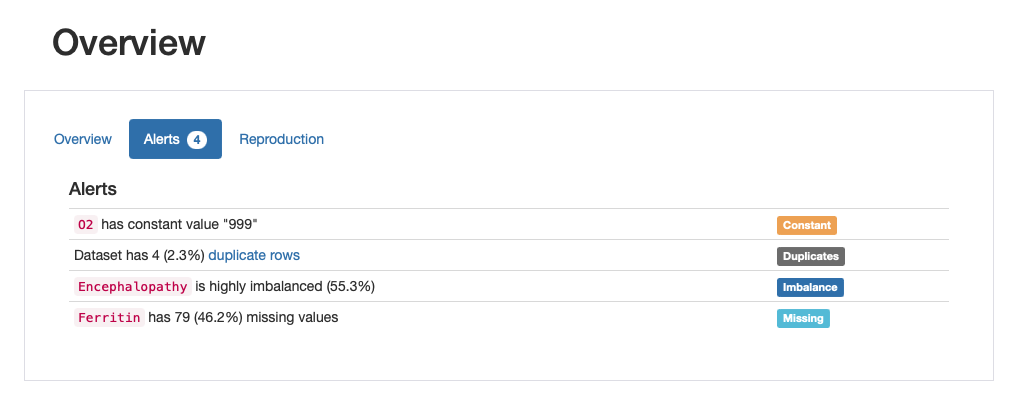
Pandas Profiling automatically detects a list of data quality issues, such that data scientist can easily figure out what and where are the issues, discuss their validity, and mitigate them effectively.
In its current version, the package supports a comprehensive list of data quality alerts such as high ratios of missing or imbalanced data, high correlation, and skewness, among other important inconsistencies. For the full list of alerts you may want to refer to the documentation of the package.
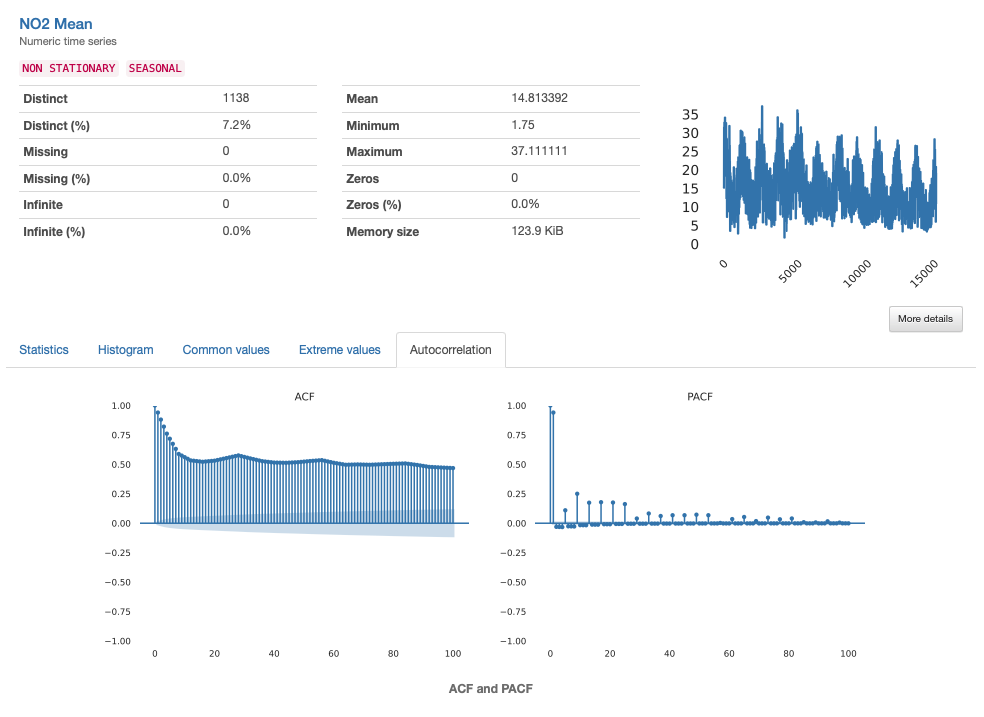
Pandas Profiling has been extensively used for analyzing tabular data by data scientists all over the world. However, a feature that seemed to be missing was the ability to handle time-series data as well.
The support for time-series data was one of the major features launched for Pandas Profiling this year.
In a world that has become more and more data-driven (and with time-series data constituting one of the most common types of data) mining it efficiently is a must-have skill for data science practitioners… and their tools!
Luckily, Pandas Profiling library now incorporates this fantastic feature.
Finally, the comparison report. This has actually been a major feature requested by the community for the past few years, due to shared pain of having to manually compare profile reports to assess data transformations and quality improvements:
Well, guess what? Pandas Profiling now supports a “side-by-side” comparison report that lets us automate the comparison process and produce faster and smarter transformations on our data:
When building a model, we can assess the representativity (beyond simple stratification) of a training set versus a validation set or test set;
When performing data transformations, we can iteratively check the impact of the introduced modifications on overall data quality (e.g., comparing data imputation or augmentation results);
When auditing models in production, we can monitor data quality by comparing the data of the current period with the previous period or a baseline from model development.

YData has been fully dedicated to improve Pandas Profiling to meet the needs of our growing community.
If you have a cool feature request, just let us know in the comments or join our community to discuss it directly with the development team.
Oh, and if you have been using Pandas Profiling and you love it, we need your support to keep pushing boundaries. Give us your feedback here and help us improve it!
Also, I absolutely cannot spill the tea on this one, but we may have some news very, very soon… Let’s keep in touch?